Office for Coastal Management
Tourism and recreation.
Fast Facts / Tourism and Recreation
Tourism and recreation support a wide range of businesses in the nation’s shore-adjacent zip codes, from restaurants, hotels, aquariums, and marinas to boat manufacturers and sporting goods stores. The following facts are based on the latest available economic data 1 (2018).

2.5 Million People
Almost 2.5 million people are employed by ocean-based tourism and recreation.
$66 Billion Earnings
Workers in the ocean-based tourism and recreation sector earned about $65.6 billion in annual wages.
$143 Billion GDP
Ocean-based tourism and recreation contributes approximately $143 billion in gross domestic product to the national economy each year.
An Industry Leader
The ocean-based tourism and recreation sector employs more Americans than the entire real estate industry, as well as more people than building construction and telecommunications combined.
Steady Growth
The industry added 54,000 jobs (2.3 percent growth) from 2017 to 2018—adding jobs at a slightly higher rate than the overall U.S. economy (1.6 percent growth).
In terms of employment, California, Florida, New York, Hawaii, and New Jersey are the five largest contributors to marine-based tourism and recreation, accounting for more than half of this sector’s total employment in 2018. In terms of gross domestic product, New York, California, Florida, Hawaii, and Washington State were the five largest contributors, accounting for more than half the national gross domestic product of this sector in 2018.
Leisure and Hospitality in Coastal Counties
In the larger economic sector of leisure and hospitality*, which includes all hotels and restaurants located in shoreline-adjacent counties, the economic contributions are also substantial. Statistics 2 include the following:
- Employs almost 6.9 million people
- Generates over $196 billion in earnings
- Contributes $427 billion to the gross domestic product
*Note: Economics: National Ocean Watch (ENOW) is a NOAA economics database on the Digital Coast that features time-series data focused on the six economic sectors that are dependent on the oceans and Great Lakes. ENOW's tourism and recreation statistics are good indicators of coastal and ocean tourism because they estimate the ocean-dependent portion of business for hotels and restaurants by including only those establishments located in shore-adjacent zip code areas, and they exclude all forms of sports and entertainment that are not ocean-related.
Statistics for the leisure and hospitality sector, on the other hand, include all hotels and restaurants located anywhere in a shore-adjacent county, many of which are far from the coast and have very little business connected to ocean tourism. These statistics also include activities associated with all forms of sports and entertainment, including sports arenas (e.g., professional baseball and football stadiums), Broadway plays, casinos, and racetracks.

Source: NOAA Office for Coastal Management
1: Economics: National Ocean Watch
2: Total Economy for US Coastal Shoreline Counties
Additional Fast Facts
- Aquaculture
- Blue Carbon
- Climate Change Predictions
- Coral Reefs
- Economics and Demographics
- Great Lakes
- Hazard Mitigation Value
- High Tide Flooding
- Hurricane Costs
- Land Cover Change
- Marine Debris
- Marine Economy
- Natural Infrastructure
- Research Reserves
- Wetland Benefits
- Shoreline Length
- Coastal Fast Facts
- Coastal Land Cover
- Top Ten Natural Infrastructure
- Top Ten Marine Economy
Coastal Tourism

Description of Coastal Tourism:
U.S. coasts are host to a multitude of travel, tourism, and recreation activities. To manage our coasts, plan for development, and assess impacts as a result of coastal hazards including sea level rise, it is important to have baseline economic information. To accomplish this, we need indicators of the economic value of recreation and tourism. We present the annual total change in billions of dollars of goods and services (GDP), employment and annual wages provided from tourism industries in the Gulf of Mexico, Mid-Atlantic, Northeast, Hawaii-Pacific Islands, Southeast, and California Current regions. This data does not include industries located in U.S. territories.
Data Source:
The figures reported here lag three years and come from the most recently available data sets issued by the Bureau of Labor Statistics and the Census Bureau. The onset of the COVID-19 pandemic in 2020 coincided with significant declines in marine economy employment and output, particularly in the tourism and recreation sector. The overall U.S. economy returned to growth in 2021 and 2022, but marine economy data are not yet available for those years, nor in this year’s report. Subsequent years of data will shed light the U.S. marine economy’s response to and recovery from pandemic-related disruptions.
Coastal Tourism GDP, employment, and real wage data was taken from NOAA’s Office of Coastal Management Economics: National Ocean Watch (ENOW) custom report building tool . Growth was estimated by subtracting the previous year’s value from the current year’s value, then dividing by the previous year’s value to present a percentage. All data was deflated to 2012 constant dollars using the Bureau of Economic Analysis’ chained dollar methodology.
For the most up to date data, please visit the original source linked above.
kayaking icon
Understanding the Time series plots
Time series plots show the changes in each indicator as a function of time, over the period 1980-present. Each plot also shows horizontal lines that indicate the median (middle) value of that indicator, as well as the 10th and 90th percentiles, each calculated for the entire period of measurement. Time series plots were only developed for datasets with at least 10 years of data. Two symbols located to the right of each plot describe how recent values of an indicator compare against the overall series. A black circle indicates whether the indicator values over the last five years are on average above the series 90th percentile (plus sign), below the 10th percentile (minus sign), or between those two values (solid circle). Beneath that an arrow reflects the trend of the indicator over the last five years; an increase or decrease greater than one standard deviation is reflected in upward or downward arrows respectively, while a change of less than one standard deviation is recorded by a left-right arrow.

Percent Change in Coastal Tourism Sector GDP
Between 2015 and 2020 the average change in coastal county tourism GDP showed a decreasing trend.

Values correspond to percent change in the GDP of the Tourism Sector of Coastal Counties in US States that border a region
Description of Time Series: Between 2015 and 2020 the average change in coastal county tourism GDP showed a decreasing trend.
Indicator Source Information
Coastal tourism Gross Domestic Product is the total measure (in billions of 2012 dollars) of goods and services provided from various industries involved in tourism services and products along the coast. Data for Coastal Counties come from the US Census Bureau. This dataset represents US counties and independent cities which have at least one coastal border and select non-coastal counties and independent cities based on proximity to estuaries and other coastal counties. The dataset is built to support coastal and ocean planning and other activities pursuant to the Energy Policy Act, Coastal Zone Management Act, Magnuson-Stevens Fishery Conservation and Management Act, National Environmental Policy Act, Rivers and Harbors Act and the Submerged Lands Act.
Hawai'i
Between 2015 and 2020 the average change in coastal county tourism GDP showed a significant decreasing trend.

Description of Time Series: Between 2015 and 2020 the average change in coastal county tourism GDP showed a significant decreasing trend.
California Current

Gulf of Mexico

Description of Time Series: Between 2015 and 2020 the average change in coastal county tourism GDP showed a significant decreasing trend.

Great Lakes

Lake Ontario

Description of Time Series:
Between 2015 and 2020 the average change in coastal county tourism GDP showed an upward trend.

Description of Time Series: Between 2015 and 2020 the average change in coastal county tourism GDP showed an upward trend.
Lake Michigan

Lake Superior

Percent Change in total Employment of the Tourism Sector in Coastal Counties
Between 2015 and 2020 the average change in coastal county employment showed a decreasing trend.

Values correspond to percent change in the total Employment of the Tourism Sector of Coastal Counties in US States that border a region
Description of Time Series: Between 2015 and 2020 the average change in coastal county employment showed a decreasing trend.
Indicator Source Information:
Coastal tourism employment is the total measure of jobs in tourism industries along the coast. Data for Coastal Counties come from the US Census Bureau. This dataset represents US counties and independent cities which have at least one coastal border and select non-coastal counties and independent cities based on proximity to estuaries and other coastal counties. The dataset is built to support coastal and ocean planning and other activities pursuant to the Energy Policy Act, Coastal Zone Management Act, Magnuson-Stevens Fishery Conservation and Management Act, National Environmental Policy Act, Rivers and Harbors Act and the Submerged Lands Act.
Between 2015 and 2020 the average change in coastal county employment showed a significant decreasing trend.

Description of Time Series: Between 2015 and 2020 the average change in coastal county employment showed a significant decreasing trend.

Northeast US

Southeast US

Percent Change in Real Wage Compensation for the Tourism Sector of Coastal Counties
Between 2015 and 2020 the average change in coastal county real wage compensation showed a decreasing trend.

Values correspond to percent change in the total real wage compensation of the Tourism Sector of Coastal Counties in US States that border a region
Description of Time Series: Between 2015 and 2020 the average change in coastal county real wage compensation showed a decreasing trend.
Coastal tourism wage is the measure of wages (nominal) paid to employees in tourism industries along the coast. Data for Coastal Counties come from the US Census Bureau. This dataset represents US counties and independent cities which have at least one coastal border and select non-coastal counties and independent cities based on proximity to estuaries and other coastal counties. The dataset is built to support coastal and ocean planning and other activities pursuant to the Energy Policy Act, Coastal Zone Management Act, Magnuson-Stevens Fishery Conservation and Management Act, National Environmental Policy Act, Rivers and Harbors Act and the Submerged Lands Act.
Between 2015 and 2020 the average change in coastal county real wage compensation showed a significant decreasing trend.

Description of Time Series: Between 2015 and 2020 the average change in coastal county real wage compensation showed a significant decreasing trend.

Between 2015 and 2020 the average change in coastal county real wage compensation showed an increasing trend.

Description of Time Series: Between 2015 and 2020 the average change in coastal county real wage compensation showed an increasing trend.

Modal title
Time series plots show the changes in each indicator as a function of time, over the period 1980-present. Each plot also shows horizontal lines that indicate the median (middle) value of that indicator, as well as the 10th and 90th percentiles, each calculated for the entire period of measurement. Time series plots were only developed for datasets with at least 10 years of data. Two symbols located to the right of each plot describe how recent values of an indicator compare against the overall series. A black circle indicates whether the indicator values over the last five years are on average above the series 90th percentile (plus sign), below the 10th percentile (minus sign), or between those two values (solid circle). Beneath that an arrow reflects the trend of the indicator over the last five years; an increase or decrease greater than one standard deviation is reflected in upward or downward arrows respectively, while a change of less than one standard deviation is recorded by a left-right arrow.

Professional Association of Diving Instructors (PADI)
The Professional Association of Diving Instructors (PADI) is a recreational diving membership and diver training organization

Regional Economy of Fisheries (GDP) and Percent Regional Economy Dependent on Fisheries: National Ocean Economics Program
Ocean Economy data include only ocean related activities and industries compiled from the databases of the Bureau of Labor Statistics. Data for the years 1990 to 2004 were generated by the National Ocean Economics Program. Data for all years beyond 2004 were generated by the NOAA Coastal Services Center. To access Coastal Economy data, which contain all sectors and industries of the coastal states, see Coastal Economy Data.

Regional Economy of Fisheries (Number of Establishments, Employments) and Percent Regional Economy Dependent on Fisheries: National Ocean Economics Program:

Inventory of Coastal Recreation and Tourism Data
As more communities turn to tourism for economic development, it becomes crucial to develop a sustainable tourism industry that enhances both communities and the environment. The NOAA Office for Coastal Management partnered with the Eastern Research Group to create an inventory of national and select state-level data on social and economic impacts of recreation and tourism, as well as associated environmental information on the impacts on natural resources. States included within the inventory are California, Florida, Hawaii, Massachusetts, North Carolina, and Ohio.

Coastal tourism

Coastal and maritime tourism is the largest sector of the EU Blue Economy in terms of GVA and employment, with EU coastal areas being highly sought-after destinations for both European and international travellers. Over half of the EU bed capacity is located in regions with a sea border 1 .
Tourism plays a significant role in the economies of many non-landlocked EU Member States, particularly in Southern Europe, where it contributes a substantial portion of their total national revenue 2 .
At the same time, coastal regions are those with the highest seasonality, i.e., with tourism demand concentrated in a limited number of months, usually July and August 3 .

The Coastal tourism sector comprises recreational activities in the proximity of the sea (e.g. beach-based tourism, coastal walks, wildlife watching) as well as those in the maritime area, including nautical sports (e.g. sailing, scuba diving, cruising, etc.). The socio-economic statistics presented in this section originate from three typologies of activities typically undertaken by tourists as reported by EU Member States, attributed to coastal areas on the basis of a specific computation methodology:
- Accommodation , i.e. nights spent at tourist accommodation establishments in coastal areas;
- Transport , reflecting the maritime proportion of sea-borne, road, rail and air passenger travel;
- Other expenditures , covering specific tourist expenditures in coastal areas (e.g., food & beverage services, cultural and recreational goods, purchase of water-sport equipment and clothing, etc.).

The sector was hit hard by the COVID-19 pandemic in 2020. In 2021, the coastal tourism sector recovered, but still did not reach the pre-crisis level. The GVA generated by the sector amounted to €49.9 billion, up from €28.6 billion registered in 2020, i.e., a year-on-year 74% increase, but still a 38%-contraction compared to 2019. Gross profits, at €16.1 billion, increased 4.2 times compared to 2020. Nonetheless, the sector’s turnover resulting from the aggregation of the abovementioned sub-sectors amounted to €140.0 billion (Figure 2.14).

In 2021, Spain led the Coastal tourism sector in terms of employment contributing 22% of jobs, followed by Greece with 19%, France with 13% and Italy with 9%. The sub-sector Accommodation employed almost 848 000 persons, accounting for about 44% of the jobs, while about 812 000 persons (42%) were employed in Other services (e.g. restaurants), and about 263 000 persons (14%) were employed in Transport.
In terms of GVA, Spain led with 23%, France with 20%, and Italy with 11% in 2021. The sub-sector Accommodation generated €24 billion in GVA, about 48% of the sector’s GVA, while other services generated €16.7 million (34%) and Transport €9.1 million (18%).

Coastal tourism was hit hard by the Covid-19 pandemic and is taking longer than other blue economy sectors to recover. The overall tourism sector was hit hard by the pandemic in 2020, even if coastal tourism was the least affected typology. Controlling for restrictions, the loss in guest nights in 2020 compared to 2019 was relatively higher in urban and rural destinations, indicating higher preferences from tourists for coastal destinations 4 .
The first priority area of the “Coastal and Maritime Strategy” of 2014 highlights “opportunities for cruise tourism” in a sustainable manner.
According to industry representatives, the cruise sector represented 1.2 million jobs and contributed $150 billion to the global economy before the Covid-19 pandemic. With around sixty ports suitable for cruise ships, Europe ranks second behind the American continent.
It has a notable effect on regions and countries with cruise ports, contributing to job creation, port infrastructure development, and the stimulation of local economies. However, cruise tourism also encounters substantial criticism for its significant impacts, particularly concerning pollution, carbon footprint, etc. 5
Measuring the exact economic impact of this type of tourism on the local economy can be challenging due to the lack of overnight stays, which sets it apart from other forms of tourism. Tourists typically visit for the day, participating in activities such as shopping and dining. To accommodate the arrival of hundreds or even thousands of tourists, host cities need to have robust infrastructure, logistics, transportation, and services in place.
Number of passengers by country
The Eurostat dataset 6 includes data on cruise passengers, including both those making stopovers and those starting or ending their cruise. However, this study does not consider expenses in the embarkation port such as hotel accommodations, restaurants (however it might be considered in standard coastal tourism economic impact assessment based on overnight stays). The graph below illustrates the volume of tourists (in thousands) disembarking during their cruises in European countries.
Throughout the 2010s, the cruise tourism industry experienced rapid growth from 12 to 17 million passengers disembarking in EU ports, offering an expanding array of itineraries, varying lengths of stay, and diverse ports of call. Italy and Spain emerged as the top two European countries hosting the highest number of cruise passengers. Together they represented half of all European cruise passengers in 2019, i.e., over 8 million people.
However, the onset of the COVID-19 pandemic halted cruise operations for over 4 months, with a slow recovery due to strict restrictions. There has therefore been an exceptional 16-fold reduction in stopover passengers between 2019 and 2020.
During this period, the sector utilised the pause to rebuild and construct ships with greater environmental sustainability and increased capacity. Since then, the industry has largely resumed its operations, returning progressively to pre-pandemic levels.

Number of passengers by port
Eurostat also provides a breakdown of cruise passengers by port, allowing them to group them by seaboards. Certain countries, like Italy and Spain, have ports hosting cruise ships on two seaboards. In 2022, the most important seaboard in the EU-27 in terms of number of cruise passengers was Western Mediterranean (almost half of the EU total with Barcelona, Palma de Mallorca and Civitavecchia as main ports), followed by Northern Europe (with Antwerp-Bruges and Hamburg being the main ports) and Scandinavia/Baltic (Kiel being the main port).

*Fig. 3: This method leads to a sum of visitors per country slightly lower than the figures obtained in the database by country but the breakdowns by seaboards are comparable.
Measuring the economic impacts of cruise tourism
Hosting countries can receive economic benefits from cruise tourism:
- Revenue from passengers’ expenditure : Cruise tourists typically spend money on various goods and services such as shopping, dining, tours, and transportation, directly benefiting local businesses and contributing to the economy.
- Port Fees and Taxes : Cruise lines pay fees to dock their ships at ports, and passengers may incur local taxes or tariffs, contributing to the revenue of port authorities and local governments.
- Job Creation : Cruise tourism creates employment opportunities in sectors like hospitality, retail, transportation, and entertainment, providing jobs for local residents.
- Infrastructure Development : Ports may invest in infrastructure improvements to accommodate cruise ships, leading to long-term economic benefits by enhancing port capacity and attracting additional tourism-related businesses.
- Multiplier Effect : Cruise tourism generates indirect effects through supply chain linkages and multiplier effects, stimulating economic activity and job creation beyond direct passenger spending.
Overall, cruise tourism can be a significant driver of economic growth and development for host countries, particularly those with attractive port destinations and supportive infrastructure.
Despite the economic benefits that cruise tourism offers, it is also subject to criticism and various challenges. Some of the main criticisms and challenges associated with the cruise industry include: air and water pollutions, waste management, overcrowding in port cities, regulatory challenges due to the specific status of the cruise industry, etc.
Spending patterns of cruise passengers
The average expenditure of cruise passengers in ports varies significantly based on factors such as destination, cruise line, duration of the cruise, demographics, and individual spending habits. Research from Cruise Lines International Association (CLIA) indicates that, in Europe, expenditure varies with a range of €50 to €150 per day per passenger. These figures are approximate and can differ based on the port, itinerary, and passenger preferences.
Cruise lines and port authorities often analyse spending patterns to tailor offerings and improve the overall passenger experience in each region. Based on a literature review, the amount of money spent by cruise passengers during their stopovers varies between €30 and €70 on average in Europe. Among these sources, no significant differences are observed across EU seaboards as variations of expenses depend on other drivers.
Then, by multiplying this individual expenditure with Eurostat data by seaboards, we estimated the contribution of cruise tourists' spending to the EU local economies. We based our estimates on 3 scenarios of average expenditure:
- “high”: €70
- “medium”: €50
In 2022, the sum of cruise passengers’ expenditure in Europe ranges between €276 and €644 million according to the calculations. Before COVID-19 it was between €465 million and €1 billion. For EU-27 only, the total amounted to €274 and €644 million in 2022. These estimates are much lower than the estimates of the Cruise Lines International Association that consider a €44 billion economic contribution and 315 000 jobs provided by the industry in Europe in 2021 7 . This highlights that cruise passengers onshore expenditures may only represent a limited share of the economic contribution of the sector.

Towards sustainability
While recovering from the Covid-19 pandemic, the Coastal tourism sector has engaged in the sustainability transition with the aim to green its operations, reduce its negative impacts on the marine environment, and strengthen its resilience to exogenous shocks such as commodity and fuel price inflation.
For this purpose, the European Commission has published the Tourism Transition Pathway involving all tourism stakeholders. The updated Industrial Strategy (2021) calls for the acceleration of green and digital transformation to increase the European economy's resilience.
The strategy also identifies 27 initiative areas for the green and digital transition to improve tourism in the EU. These include:
• Regulation and public governance , which includes; improving statistics and indicators for tourism and comprehensive tourism strategies.
• Green and digital transition , which includes; research and innovation projects on circular and climate-friendly tourism and support for digitalisation of tourism SMEs and destinations.
• Resilience , which includes; seamless cross-border travelling, fostering skills in tourism, promoting fairness and equality in tourism jobs, and accessibility.
As part of the EU Sustainable Blue Economy , the coastal and maritime tourism sector has been identified as an area with potential to foster a smart, sustainable and inclusive Europe. The EU's tourism policy aims to keep Europe's position as a leading tourist destination while also maximising the industry's contribution to economic growth and jobs.
Interaction with other sectors
While European destinations are welcoming tourists at pre-pandemic levels, the rise in tourist numbers and their concentration in attractive touristic destinations may generate issues of over tourism, particularly in coastal areas and small island. Increasing tourism intensity requires long-term solutions .
At the same time, Covid-19 will likely have long-term impacts on EU citizens’ travelling behavior. A recent Eurobarometer survey showed that 82% of EU citizens are ready to change their travel and tourism habits to be more sustainable, for example, by consuming local products (55%), choosing ecological means of transport (36%) or by paying more to protect the natural environment (35%) or to benefit the local community (33%). The survey also found out that 38% of European respondents are expecting more domestic travelling in the future .
One example of a sustainable approach to coastal and maritime tourism is the ECO-CRUISING FU_TOUR .
For many experts in the business, this is a game-changing opportunity that will lead to greater and faster adoption of more sustainable environmental solutions and greater respect for coastal natural and cultural qualities of coastal areas. The European Green Deal and the new EU Sustainable Blue Economy can help in such green transitions, thanks to policy reforms, specific financial mechanism, as well as innovation, digitalisation, education and training.
1 European Commission. Coastal and maritime tourism. https://ec.europa.eu/growth/sectors/tourism/offer/maritime-coastal_en .
2 Eurostat. 2023. Tourism Satellite Accounts in Europe – 2023 edition: Available at: https://ec.europa.eu/eurostat/web/products-statistical-reports/w/ks-ft-22-011 .
European Commission. Tourism Dashboard. Available at: https://tourism-dashboard.ec.europa.eu/map-view?lng=en&ctx=tourism&is=TOURISM&ts=TOURISM&pil=indicator-level&tl=0&i=344&clc=socio-economic-vulnerability&db=1289&it=ranking-chart&cwt=bar-chart .
3 Eurostat (2022). Tourism statistics - seasonality at regional level. https://ec.europa.eu/eurostat/statistics-explained/index.php?title=Tourism_statistics_-_seasonality_at_regional_level#The_regions_with_the_highest_seasonality_are_coastal_regions .
Batista e Silva, F., Barranco, R., Proietti, P., Pigaiani, C., & Lavalle, C. (2021). A new European regional tourism typology based on hotel location patterns and geographical criteria. Annals of Tourism research, 89, 103077. https://doi.org/10.1016/j.annals.2020.103077 .
4 Curtale, R., Batista e Silva, F., Proietti, P., & Barranco, R. (2023). Impact of COVID-19 on tourism demand in European regions-An analysis of the factors affecting loss in number of guest nights. Annals of Tourism Research Empirical Insights, 4(2), 100112. https://doi.org/10.1016/j.annale.2023.100112 .
5 The return of the cruise – How luxury cruises are polluting Europe’s cities. TE- Transport Environment.
6 Data source: Eurostat Passengers embarked and disembarked in all ports by direction - annual data [mar_pa_aa] .
7 State of the Cruise Industry 2023 – Cruise lines international association.
Share this page
- Ways to Give
- Contact an Expert
- Explore WRI Perspectives
Filter Your Site Experience by Topic
Applying the filters below will filter all articles, data, insights and projects by the topic area you select.
- All Topics Remove filter
- Climate filter site by Climate
- Cities filter site by Cities
- Energy filter site by Energy
- Food filter site by Food
- Forests filter site by Forests
- Freshwater filter site by Freshwater
- Ocean filter site by Ocean
- Business filter site by Business
- Economics filter site by Economics
- Finance filter site by Finance
- Equity & Governance filter site by Equity & Governance
Search WRI.org
Not sure where to find something? Search all of the site's content.
Building a Sustainable Coastal and Marine Tourism Economy
The tourism industry was estimated to become the largest ocean economy by 2030 (OECD), but COVID-19 severely impacted all parts of the tourism value chain. Oceans and coasts are at the heart of tourism, as 80% of all tourism takes place in coastal areas. 183 countries have coastlines, 37% of the world’s population live in coastal communities and most commodities extracted from the ocean come from coastal regions (UNWTO, 2014). The new realities have awakened a new approach to tourism, particularly from island and coastal nations.
In 2020 the High Level Panel for a Sustainable Ocean Economy (Ocean Panel) set a goal of a sustainable tourism economy by 2030: “Coastal and ocean-based tourism is sustainable, resilient, addresses climate change, reduces pollution, supports ecosystem regeneration and biodiversity conservation and invests in local jobs and communities.” This guidance has been taken by government and industry in the approach to a recovery of the tourism sector. The Tourism Action Coalition for a Sustainable Ocean was created in response to the Ocean Panel's call to action and will serve as a knowledge hub and action platform to drive sustainable coastal and ocean-based tourism.
This session will bring together representatives of the Ocean Panel countries, alongside high-level representatives from the Tourism Action Coalition for a Sustainable Ocean to address how the public and private sectors are moving toward a sustainable blue tourism economy that builds a resilient future for tourism destinations and improves the well-being of local communities.
We invite tourism stakeholders and coastal and ocean communities to join this webinar. The event promises to showcase the actions that are being taken by countries and the tourism industry to recover and rebuild after the pandemic. These actions can provide guidance in building resilience to face other health and environmental crises across sectors.
- Jamie Sweeting , CEO , Planeterra (moderator)
- Gloria Fluxa Thienemann , Vice-Chairman and Chief Sustainability Officer , Iberostar Hotels & Resorts
- Daniel Skjeldam, CEO , Hurtigruten Group
- Cesar Daniel Gonzalez Madruga, General Director , SECTUR Mexico
- Louise Twining-Ward , Senior Private Sector Development Specialist , The World Bank
- Rita Marques , Secretary of State of Tourism, Portugal (keynote)
How You Can Help
WRI relies on the generosity of donors like you to turn research into action. You can support our work by making a gift today or exploring other ways to give.
Stay Informed
World Resources Institute 10 G Street NE Suite 800 Washington DC 20002 +1 (202) 729-7600
© 2024 World Resources Institute
Envision a world where everyone can enjoy clean air, walkable cities, vibrant landscapes, nutritious food and affordable energy.
- Get Involved

Recreation & Tourism
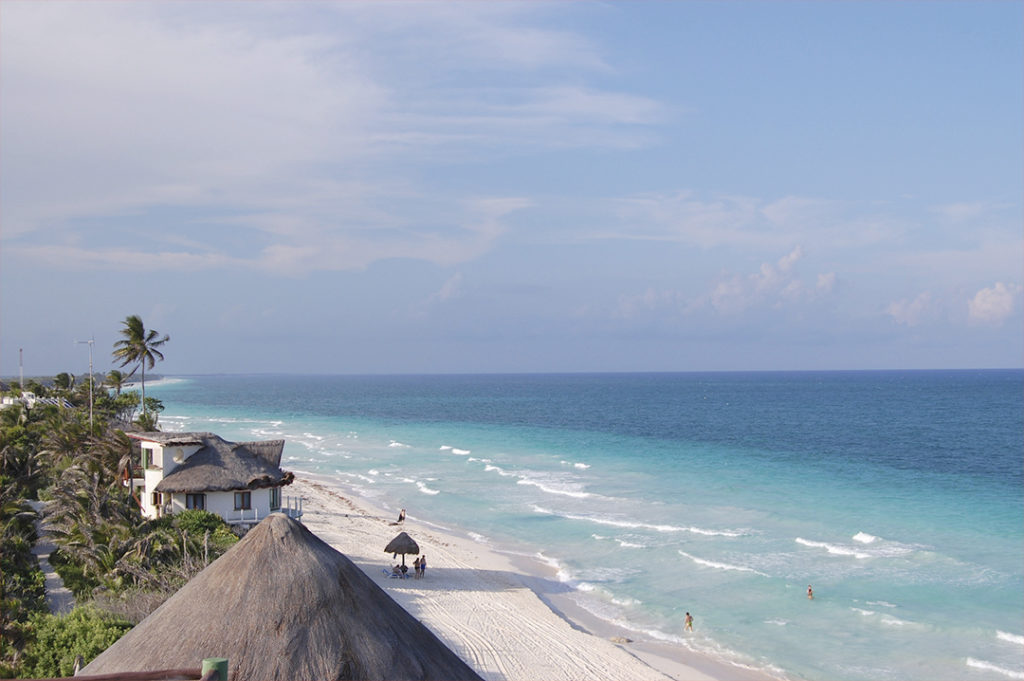
Offering clean, calm water, pristine beaches, superlative seafood and stunning vistas, coral reefs and other marine and coastal ecosystems form the land and seascape that many tourists, consciously or unconsciously, have come to enjoy

Divers in St Lucia because of its high natural values.
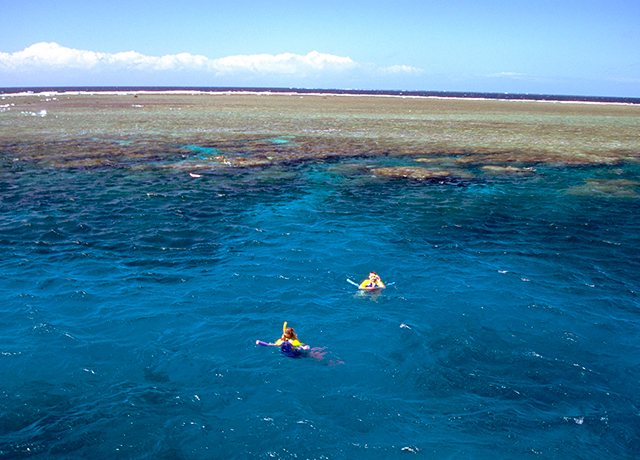
- On reef activities
- Nature dependent beaches
- Paddle sports
- Recreational/sports fishing
- Whale and dolphin watching
- Birdwatching
- Seafood restaurants
The underlying approach for all of this work involved a unique combination of utilising existing data from very large public sources – including an important collaboration with the online travel platform TripAdvisor – and extensive local outreach and knowledge. Initial parsing of very large volumes of information was undertaken using both image and text recognition filtering and included valued support from Microsoft’s AI for Earth team. In this way some 90,000 independent data points were developed showing locations where nature is supporting tourism and recreation.
More information, including details of the individual models can be found here https://oceanwealth.org/project-areas/caribbean/crop/ and the maps themselves can be explored here https://maps.oceanwealth.org/oecs/ . Reports and a peer reviewed publication can be located here https://oceanwealth.org/resources/research-library/

Birdwatching depends on well-managed natural areas, but can draw people from around the world.
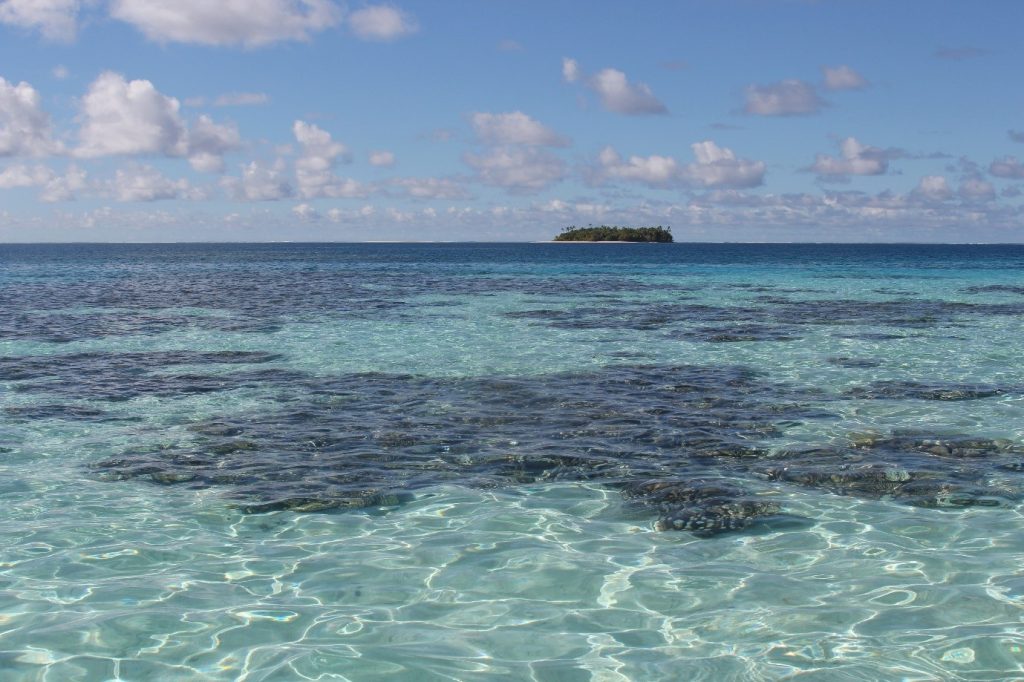
Coral reefs and clear waters in the Indian Ocean.
Similar approaches have also been used to understand nature dependency in tourism in the Seychelles, https://oceanwealth.org/project-areas/seychelles/ where the information are already being utilised in ongoing Marine Spatial Planning exercises, and new work using these techniques is underway.
Global Coral Reef Tourism
Clearly only part of the tourism close to coral reefs is linked to the reefs. We conservatively assigned 10 percent of this tourism expenditure to what we called “reef adjacent” tourism. This is the “added value” we consider that reefs bring through the provision of calm water, white-sand beaches, top seafood and beautiful views. We then developed an estimate focused specifically on the “on-reef” tourism. This is the direct “use” of reefs, primarily for diving and snorkeling. We estimated this using two further datasets: the location of dive shops/centers and the location of underwater photographs on Flickr. Both independently, help us to approximate the amount of “on-reef” activities. For instance, where there are higher numbers of dive centers per hotel, or where underwater photos make up a higher proportion of all photos. We can then infer that diving and snorkeling will be an important part of the tourism agenda.
The final stage of the mapping work was to link the values of the two components of tourism back out to the reefs that provide this value. We used a combination of proximity measures (for the reef-adjacent values) and direct-use locations derived from both the underwater photos and from large crowd-sourced datasets of dive sites worldwide.
The results show many reefs (about 70 percent of the world total) are likely not important for coral reef tourism, but elsewhere the values are highly variable. Many leading coral reef tourism destinations are developing economies such as the Solomon Islands, Fiji, Belize or Honduras. Many are also small island nations with few other economic alternatives. For them, reef tourism is a lifeline, giving a critical boost to local economies.
Currently, the MOW team is working on a project to refine these results using a combination of machine learning and artificial intelligence, and enhanced social media scraping techniques. Through a partnership with Microsoft and Esri, the MOW team is using image recognition to identify underwater photographs that have been uploaded to Flickr. In the original model, underwater images from Flickr were identified based on tags manually inserted by Flickr users. The team anticipates that using image recognition techniques will result in a more robust input dataset, leading to more accurate model results.
In a related project, JetBlue and the World Travel and Tourism Council supported work to refine the estimates of reef-adjacent tourism in the Caribbean by using a combination of a literature review and social media to devise national estimates on the importance of coral reefs to reef-adjacent activities. In the original model, reef-adjacent tourism was assigned a value of 10% across all jurisdictions. This project refined that approach by using a combination of social media content, layered with traditionally sourced data fro government agencies and the tourism industry to refine estimates of reef adjacent tourism that vary by country. Read more in the report and project summary .
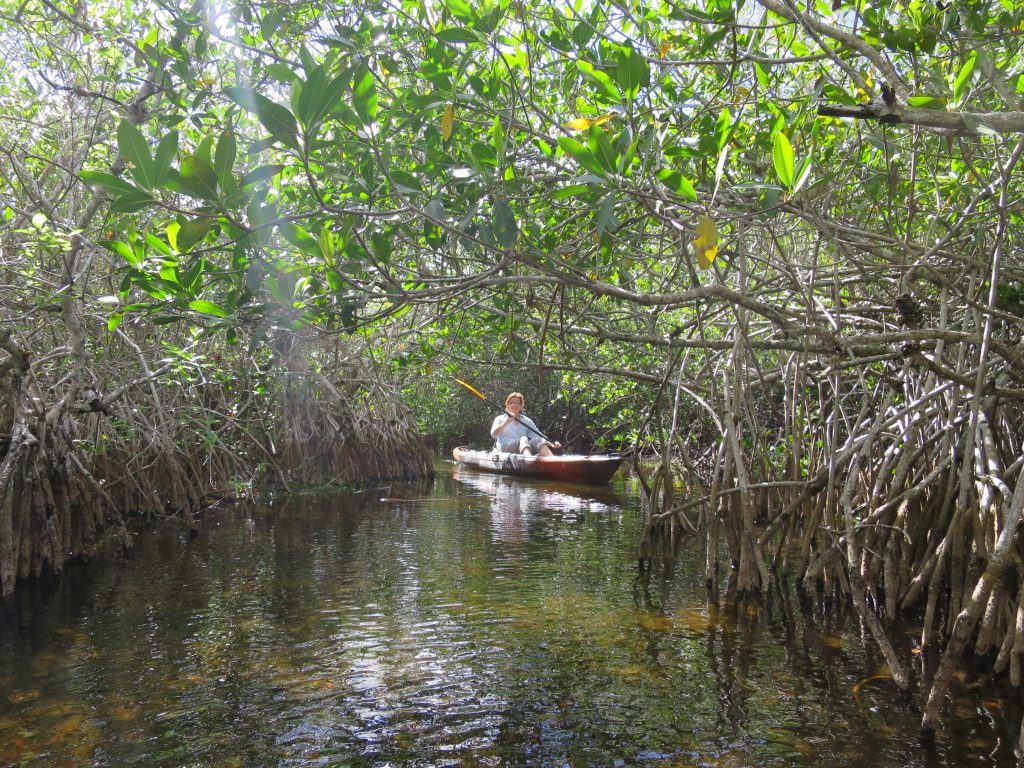
Mangrove Tourism

The global reach of mangrove tourism is extensive, with almost 4,000 attractions in 93 countries listed as having mangroves. Many sites have hundreds of individual reviews. The number of reviews may be some indication of visitation, but they can also be searched to find activities, which include kayaking, wildlife tours, boardwalks and fishing. Inset shows the distribution around the eastern Caribbean Sea.
While mangrove tourism is unlikely to compete with some of the larger mass-tourism attractions, this initial work provides a critical caution to coastal developers, and highlights potential opportunities. Mangroves have many values and adding tourism to the list may help countries to secure a future for a habitat that also feeds, protects and stores carbon. Read the full study here . View map here .
Wildlife Watching

At the same time, interest in marine megafauna such as sharks, whales, dolphins and turtles has boomed. While some of these animals are still hunted, their value to fishers is dwarfed in many areas by their potential value in the tourism industry when they are alive. As an example, some 600,000 people have been estimated to spend over US$300 million annually to watch sharks, securing some 10,000 jobs worldwide. Worked down to individual locations, such values can be incredible. In Palau, for instance, an estimated population of 100 sharks are supporting $18 million worth of shark diving each year.
The Mapping Ocean Wealth team is exploring the value of wildlife viewing tourism at the regional level. Read more here about our work in the Gulf of California.
Additional Information
Recreation & tourism.
Coral reefs are the poster child of nature-based tourism. Over 350 million people annually travel to the coral reef coasts of the world. Many come specifically to visit the reefs themselves, to swim over shimmering gardens of coral amongst hordes of fish, but many more are unknowing beneficiaries of the reefs as producers of sand, coastal protection, food and remarkable vistas. These travelers support whole industries—hotels, shops, tours, airlines and supply chains that to cater to their every need, from dive equipment to food.
Mangrove forests might not be at the forefront of attention when it comes to tourism, and some even have a reputation for both biting insects and thick mud, but there is another vision of mangroves which is quite different. Every day thousands of visitors crisscross mangroves all around the world, following boardwalks, on guided boat tours or in kayaks. They see manatees and alligators in the Florida Everglades, proboscis monkeys in Borneo; crocodiles, deer and sometimes even tigers in the Sundarbans.
Recreational fishers are equally drawn to mangrove forests. In Australia, barramundi and mangrove jacks are among the most sought-after recreational fishing targets. In the Caribbean, the best fishing guides are paid $200 per day or more to take fly fishers out into the “flats” among the mangrove and seagrass to catch bonefish, permit or tarpon. These recreational fisheries depend on wilderness, and on healthy mangroves, but they also create considerable economic incentives to look after mangroves and the waters around them.
Tourists choose their destinations for many different reasons—from wanting a change of climate and the solace of palm-lined coasts to culinary interest, culture, history and nature-based activities. So, the “dependency” on nature varies between tourists. Ecosystems, however, form the land and seascape that many of them, consciously or unconsciously, have come to enjoy.
Nature-dependent tourism includes all tourism that depends on natural ecosystems to provide key benefits. Much of this dependency is overlooked, or taken for granted. Thousands of popular tropical beaches are dependent on nearby coral reefs that provide sand, turquoise waters and break the incoming waves, creating calm clear waters. Elsewhere, water quality is widely enhanced by filtering and microbial cleansing linked to saltmarshes, mangroves or oyster reefs. Even the rich seafood enjoyed by millions of travelers depends on the health of nearby ecosystems.
Tourism isn’t always a good thing – its impacts on nature can be considerable. Hotel development, marinas and cruise ports have destroyed coastal habitats. Incomplete sewage treatment pollutes coastal waters. Travel itself is a potent source of greenhouse gas emissions. Even nature-based tourism can be damaging. Overfishing leads to poorer fishing for future visitors. Harassment of marine mammals or turtles can affect their behavior, reducing their feeding or breeding success. Anchor damage can destroy corals carve up seagrass beds.
It is against this background that the concept of sustainable tourism becomes critical. While tourism can cause harm, it doesn’t need to. Where tourism can be made sustainable it can enhance visitor experiences and generate long-term security for local populations. Furthermore, tourists are often highly supportive of additional charges such as park entrance fees when these are clearly going to support conservation. That way, tourism becomes a part of the solution, not an additional threat.
Coral Reefs
Mangrove forests, other ecosystems.
Top image: ©Ami Vitale. Photo Credits in Text: © Christiana Ferris, © Jason Houston, © Jeff Yonover. Tiles (left to right): © Jeff Yonover, © Tim Calver
Sustainable Coastal and Marine Ecotourism: Opportunities and Benefits
- Living reference work entry
- Latest version View entry history
- First Online: 10 March 2021
- Cite this living reference work entry

- Faizan Hasan Mustafa 7 &
- Awangku Hassanal Bahar Pengiran Bagul 7
Part of the book series: Encyclopedia of the UN Sustainable Development Goals ((ENUNSDG))
64 Accesses
Definitions
Marine ecotourism is a subsector of ecotourism and conforms to the core criteria of sustainable tourism, implying a responsible travel to natural areas that helps in conserving the environment, sustaining the well-being of the local people, and imparting an educational experience. Marine ecotourism can be land-based in coastal areas or in the sea and can achieve the sustainability objectives if it is related to the integrated coastal zone management.
Knowledge management is the process of capturing, distributing, and making an effective use of knowledge for some purposeful outcomes. This concept has grown with the expansion of knowledge and is now considered as an integrated approach to identifying, capturing, evaluating, retrieving, and sharing of information through tools such as databases, documents, policies, procedures, and experiences of the people.
Tourism carrying capacity refers to the maximum number of people that may visit a tourist destination simultaneously,...
This is a preview of subscription content, log in via an institution to check access.
Access this chapter
Institutional subscriptions
Aranda LSB (2009) Latin American handicrafts as a factor for economic, social and cultural development: handicrafts by the light of the new concepts of culture and development. United Nations Educational, Scientific and Cultural Organization (UNESCO), Paris
Google Scholar
Burke LM, Reytar K, Spalding M et al (2011) Reefs at risk revisited. World Resources Institute, Washington, DC
Day A, Laffoley D, Davis J et al (2014) Innovation in communications about marine protection. Aquat Conserv Mar Freshwat Ecosyst 24:216–237
Article Google Scholar
ECORYS (2013) Study in support of policy measures for maritime and coastal tourism at EU level. DG Maritime Affairs & Fisheries, Rotterdam/Brussels
EGMOSSD (2013) Sustainable marine tourism. In: Expert group meeting on oceans, seas and sustainable development: implementation and follow-up to Rio+20. United Nations, New York
Filho WL, Shiel C, do Paco A (2015) Integrative approaches to environmental sustainability at universities: an overview of challenges and priorities. J Integr Environ Sci 12:1. https://doi.org/10.1080/1943815X.2014.988273
Hall MC (2015) Challenges and opportunities related to the development of marine tourism to 2030: the future of ocean economy. Organization for Economic Cooperation and Development, Paris
Hall CM, Page S (2014) The geography of tourism and recreation, 4th edn. Routledge, Abingdon
Book Google Scholar
Hasan F (2011) Green economics and green business management. In: Mustafa S, Hill J (eds) Green world order: delaying the doom in a changing climate. LAP, Deutschland, pp 40–62
Healy RG (1993) Tourist merchandise as a means of generating local benefits from ecotourism. J Sustain Tour 2(3):137–151
Holden A (2013) Tourism and the green economy: a place for an environmental ethic? Tour Recreat Res 38(1). https://doi.org/10.1080/02508281.2013.11081725
Jorgenson DW, Vu KM (2016) The ICT revolution, world economic growth, and policy issues. Telecommun Policy 40:383–397
Kurbalija J (1999) Knowledge and diplomacy. University of Malta, Msidas
Lambrechts W, Liedekerke LV, Petegem PV (2018) Higher education for sustainable development in Flanders: balancing between normative and transformative approaches. Environ Educ Res 24(9):1284–1300. https://doi.org/10.1080/13504622.2017.1378622
Lozano R, Lukman R, Lozano FJ et al (2013) Declarations for sustainability in higher education: becoming better leaders, through addressing the university system. J Clean Prod 48:10–19
Marrie H (2019) Emerging trends in the generation, transmission and protection of traditional knowledge. Central Queensland University, Queensland
Masakorala PP (2005) The nature, problems and challenges of handicraft industry in Sri Lanka. In: Proceedings of the 10th international conference on Sri Lanka studies. University of Kelaniya, Sri Lanka
Mustafa S (2007) Maine BioValley. Penerbit UMS, Kota Kinabalu
Mustafa S, Estim A (2019) Blue economy and blue growth in the context of development policies and priorities in Malaysia. Penerbit UMS, Kota Kinabalu
Mustafa FH, Senoo S, Bagul AHBP (2015a) Knowledge management in modern aquaculture. In: Mustafa S, Shapawi R (eds) Aquaculture ecosystems: adaptability and sustainability. Wiley, West Sussex, pp 281–318
Mustafa FH, Senoo S, Mustafa S et al (2015b) Transforming aquaculture research and industry for management of seafood security – relevance of nurturing a unique innovation ecosystem. Int J Manag Stud 22(2):53–71
Mustafa S, Shaleh SRM, Estim A (2019a) National sustainable development strategies. In: Leal Filho W, Azul A, Brandli L, Özuyar P, Wall T (eds) Decent work and economic growth. Encyclopedia of the UN Sustainable Development Goals. Springer, Cham. https://doi.org/10.1007/978-3-319-71067-9_35-1
Chapter Google Scholar
Mustafa S, Estim A, Shapawi R (2019b) Future-proofing oceans for food security and poverty alleviation. In: Leal-Filho W, Azul A, Brandli L, Özuyar P, Wall T (eds) Decent work and economic growth. Encyclopedia of the UN Sustainable Development Goals. Springer, Cham. https://doi.org/10.1007/978-3-319-71058-7_57-1
OECD (1996) The knowledge-based economy. Organization for Economic Cooperation and Development. Report OCDE/GD(96)102 Paris
Pomering A, Noble G, Johnson LW (2011) Conceptualizing a contemporary marketing mix for sustainable tourism. J Sustain Tour 19(8):953–969
Renfors SM (2018) Developing the curriculum content of coastal and maritime tourism: stakeholders' perspective of the sector-specific skills and knowledge in Finland. Tour Mar Environ 13(2). https://doi.org/10.3727/154427318X15265996581008
Rice J, Moksness E, Attwood C et al (2012) The role of MPAs in reconciling fisheries management with conservation of biological diversity. Ocean Coast Manag 69:217–230
Schaefer J (2017) New hope for the oceans: engaging faith-based communities in marine conservation. Mar Sci 4. https://doi.org/10.3389/fmars.2017.00062
UN DESA (2019) Sustainable development goals-knowledge platform. Division for Sustainable Development Goals, Department of Economic and Social Affairs, United Nations Secretariat, New York
UNEP (2011) Green economy: pathways to sustainable development and poverty eradication: a synthesis for policy makers. United Nations Environment Program, Nairobi
UNEP-UNWTO (2012) Tourism in the green economy – background report of United Nations Environment Program and World Tourism Organization, UNWTO, Madrid
UNWTO (2018) Tourism and the digital transformation. UNWTO News 78, World Tourism Organization, Madrid
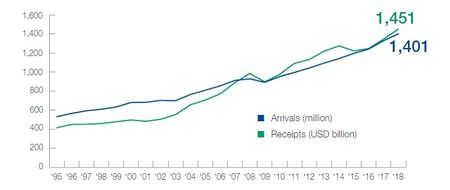
UNWTO (2019) International tourist arrivals reach 1.4 billion two years ahead of forecasts. World Tourism Organization, Madrid
WTTC (2019) Travel and tourism continues strong growth above global GDP. World Travel and Tour Council, London
WWF (2015) Reviving the ocean economy- the case for action-2015. World Wide Fund for Nature, Gland
Download references
Author information
Authors and affiliations.
Faculty of Business, Economics and Accountancy, Universiti Malaysia Sabah, Sabah, Malaysia
Faizan Hasan Mustafa & Awangku Hassanal Bahar Pengiran Bagul
You can also search for this author in PubMed Google Scholar
Editor information
Editors and affiliations.
European School of Sustainability, Hamburg University of Applied Sciences, Hamburg, Hamburg, Germany
Walter Leal Filho
Center for Neuroscience & Cell Biology, University of Coimbra, Coimbra, Portugal
Anabela Marisa Azul
Faculty of Engineering and Architecture, Passo Fundo University Faculty of Engineering and Architecture, Passo Fundo, Brazil
Luciana Brandli
HAW Hamburg, Hamburg, Hamburg, Germany
Amanda Lange Salvia
International Centre for Thriving, University of Chester, Chester, UK
Section Editor information
Natural Resources, Natural Resources Institute Finland, Helsinki, Finland
Teppo Vehanen
Rights and permissions
Reprints and permissions
Copyright information
© 2021 Springer Nature Switzerland AG
About this entry
Cite this entry.
Mustafa, F.H., Pengiran Bagul, A.H.B. (2021). Sustainable Coastal and Marine Ecotourism: Opportunities and Benefits. In: Leal Filho, W., Azul, A.M., Brandli, L., Lange Salvia, A., Wall, T. (eds) Life Below Water. Encyclopedia of the UN Sustainable Development Goals. Springer, Cham. https://doi.org/10.1007/978-3-319-71064-8_103-2
Download citation
DOI : https://doi.org/10.1007/978-3-319-71064-8_103-2
Received : 21 April 2020
Accepted : 09 June 2020
Published : 10 March 2021
Publisher Name : Springer, Cham
Print ISBN : 978-3-319-71064-8
Online ISBN : 978-3-319-71064-8
eBook Packages : Springer Reference Earth and Environm. Science Reference Module Physical and Materials Science Reference Module Earth and Environmental Sciences
- Publish with us
Policies and ethics
Chapter history
DOI: https://doi.org/10.1007/978-3-319-71064-8_103-2
DOI: https://doi.org/10.1007/978-3-319-71064-8_103-1
- Find a journal
- Track your research
- View source
- View history
- Community portal
- Recent changes
- Random page
- Featured content
- What links here
- Related changes
- Special pages
- Printable version
- Permanent link
- Page information
- Browse properties
Impact of tourism in coastal areas: Need of sustainable tourism strategy
This article discusses the current status of coastal tourism , the associated issues and impacts. The article further provides recommendations for future management of coastal tourism.
- 1 Introduction
- 2.1 Causes of coastal degradation
- 3.1 Tourist infrastructure
- 3.2 Careless resorts, operators, and tourists
- 5.1 Environmental impacts
- 5.2 Impacts on biodiversity
- 5.3 Socio-cultural impacts
- 6.1 Economic benefits
- 6.2 Environmental Management and Planning benefits
- 6.3 Socio-cultural benefits
- 7.1 Analysis of status-quo
- 7.2 Strategy development
- 7.3 Action plan
- 8 Conclusions
- 9.1 External links
- 9.2 Internal Links
- 10 References
Introduction
Since the 1992 Earth Summit in Rio de Janeiro, there is increasing awareness of the importance of sustainable forms of tourism. Although tourism , one of the world largest industries, was not the subject of a chapter in Agenda 21 , the Programme for the further implementation of Agenda 21, adopted by the General Assembly at its nineteenth special session in 1997, included sustainable tourism as one of its sectoral themes. Furthermore in 1996, The World Tourism Organization jointly with the tourism private sector issued an Agenda 21 for the Travel and Tourism Industry, with 19 specific areas of action recommended to governments and private operators towards sustainability in tourism.
On the other hand, an analysis of the sustainability policies, strategies and instruments of 21 European countries revealed a gap between good theoretical approaches and the general willingness to support a sustainable tourism development and the realisation of it, and concluded that in hardly any of the countries is sustainable tourism put in the centre of the national tourism policy as a priority area [1] .
Specific situation of coastal areas
Coastal areas are transitional areas between the land and sea characterized by a very high biodiversity. They include some of the richest and most fragile ecosystems on earth, like mangroves and coral reefs . At the same time, coasts are under very high population pressure due to rapid urbanization processes. More than half of today’s world population live in coastal areas (within 60 km from the sea) and this number is on the rise.
Additionally, among all different parts of the planet, coastal areas are those which are most visited by tourists and in many coastal areas tourism presents the most important economic activity. In the Mediterranean region for example, tourism is the first economic activity for islands like Cyprus, Malta, the Balearic Islands and Sicily.
Forecast studies carried out by WTO in 2000 estimated that international tourist arrivals to the Mediterranean coast would amount to 270 millions in 2010 and to 346 millions in 2020. However, the latter figure was reached already in 2015 [2] .
Causes of coastal degradation
Tourisms often contributes to coastal degradation. There are many other causes:
- Coastal zone urbanization
- Fisheries and aquaculture
- Port development and shipping
- Land reclamation
- Land-use conversion (Agriculture, Industrial development)
- Climate change and sea level rise
See also Threats to the coastal zone .
How does tourism damage coastal environment
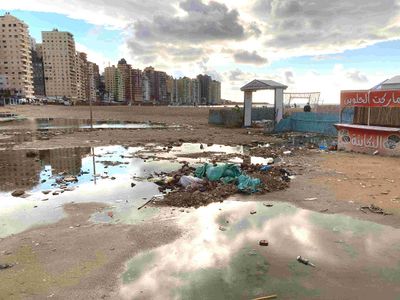
Massive influxes of tourists, often to a relatively small area, have a huge impact. They add to the pollution, waste, and water needs of the local population, putting local infrastructure and habitats under enormous pressure. For example, 85% of the 1.8 million people who visit Australia's Great Barrier Reef are concentrated in two small areas, Cairns and the Whitsunday Islands, which together have a human population of about 130,000.
Tourist infrastructure
In many areas, massive new tourist infrastructure has been built - including airports, marinas, resorts, and golf courses. Overdevelopment for tourism has the same problems as other coastal developments, but often has a greater impact as the tourist developments are located at or near fragile marine ecosystems . A few examples:
- mangrove forests and seagrass meadows have been removed to create open beaches;
- tourist developments such as piers and other structures have been built directly on top of coral reefs ;
- nesting sites for endangered marine turtles have been destroyed and disturbed by large numbers of tourists on the beaches.
Careless resorts, operators, and tourists
The damage is not only due to the construction of tourist infrastructure. Some tourist resorts empty their sewage and other wastes directly into water surrounding coral reefs and other sensitive marine habitats . Recreational activities also have a strong impact. For example, careless boating, diving, snorkeling, and fishing have substantially damaged coral reefs in many parts of the world, through people touching reefs, stirring up sediment , and dropping anchors. Marine animals such as whale sharks, seals, dugongs, dolphins, whales, and birds are also disturbed by increased numbers of boats, and by people approaching too closely. Tourism can also add to the consumption of seafood in an area, putting pressure on local fish populations and sometimes contributing to overfishing. Collection of corals, shells, and other marine souvenirs - either by individual tourists, or local people who then sell the souvenirs to tourists - also has a detrimental effect on the local environment.
The case of cruise ship tourism

Cruise ship tourism is a fast growing sector of the tourism industry during the past decades. While world international tourist arrivals in the period 1990 – 1999 grew at an accumulative annual rate of 4.2%, that of cruises did by 7.7%. In 1990 there were 4.5 million international cruise arrivals which had increased to a number of 8.7 million in 1999 and to 27 million in 2019, with gross economic benefits estimated at $150 billion in direct, indirect and induced economic benefits [3] [4] . From the 1980s to 2018, the global cruise fleet grew from 79 to 369 vessels operating worldwide, and the average cruise ship size and capacity grew from 19.000 to 60.000 gross registered tonnage (GRT). Carrying on average 4,000 passengers and 1,670 crew, these enormous floating towns are a major source of marine pollution through the dumping of garbage and untreated sewage at sea, and the release of other shipping-related pollutants.
Problems caused by cruise tourism are ubiquitous and well-documented, especially for small island nations and the Mediterranean [5] [6] .
- Discharge of sewage in marinas and nearshore coastal areas . The lack of adequate port reception facilities for solid waste, especially in many small islands, as well as the frequent lack of garbage storing facilities on board can result in solid wastes being disposed of at sea, and being transported by wind and currents to shore often in locations distant from the original source of the material.
- Coral reefs. Land-based activities such as port development and the dredging that inevitably accompanies it in order to receive cruise ships with sometimes more than 3000 passengers can significantly degrade coral reefs through the build-up of sediment . Furthermore, sand mining at the beaches leads to coastal erosion . In the Cayman Islands damage has been done by cruise ships dropping anchor on the reefs. Scientists have acknowledged that more than 300 acres of coral reef have already been lost to cruise ship anchors in the harbour at George Town, the capital of Grand Cayman.
- Socio-cultural impacts. Cruise-ship tourism can produce socio-cultural stress, since it means that during very short periods there is high influx of people, sometimes more than the local inhabitants of small islands, possibly overrunning local communities. Vital resources such as food, energy, land, water, etc. may become depleted.
- Ship emissions. Fuel-based cruise ships currently produce large amounts of greenhouse gases. The gradual replacement is only now starting. From the approximately 100 new builds planned up to 2027, one-fifth are LNG powered, corresponding to 39% of the new tonnage and 41% of the added capacity [7] .
Cruise tourism is often ascribed as hedonistic. However, a positive effect of expedition cruise tourism is its educational and awareness-creation potential for sustainability values and issues. It can transform a ‘sense of place’ to a ‘care of place’, encouraging tourists and locals to assume more responsibility [8] .
Impacts of coastal tourism
Environmental impacts
- The intensive use of land by tourism and leisure facilities
- Overuse of water resources, especially groundwater, leading to soil subsidence and saline intrusion
- Changes in the landscape due to the construction of infrastructure, buildings and facilities
- Vulnerability to natural hazards and sea level rise
- Pollution of marine and freshwater resources
- Energy demand and consumption
- Air pollution and waste
- Disturbance of fauna and local people (for example, by noise)
- Loss of marine resources due to destruction of coral reefs , overfishing
- Compaction and sealing of soils, soil degradation due to overuse of fertilizers and loss of land resources (e.g. desertification , erosion )
- Loss of public access
Impacts on biodiversity
Tourism can cause loss of biodiversity in many ways, e.g. by competing with wildlife for habitat and natural resources or by providing pathways for the introduction of alien species. Negative impacts on biodiversity are caused by various other factors, such as those mentioned above.
Socio-cultural impacts
Change of local identity and values:
- Commercialization of local culture: Tourism can turn local culture into commodities when religious traditions, local customs and festivals are reduced to conform to tourist expectations and resulting in what has been called "reconstructed ethnicity".
- Standardization: Destinations risk standardization in the process of tourists desires and satisfaction: while landscape, accommodation, food and drinks, etc., must meet the tourists expectation for the new and unfamiliar situation. They must at the same time not be too new or strange because few tourists are actually looking for completely new things. This factor damages the variation and beauty of diverse cultures.
- Adaptation to tourist demands: Tourists want to collect souvenirs, arts, crafts, cultural manifestations. In many tourist destinations, craftsmen have responded to the growing demand and have made changes in the design of their products to make them more attractive to the new customers. Cultural erosion may occur in the process of commercializing cultural traditions.
Cultural clashes may arise through:
- Economic inequality - between locals and tourists who are spending more than they usually do at home.
- Irritation due to tourist behaviour - Tourists often, out of ignorance or carelessness, fail to respect local customs and moral values.
- Job level friction - due to a lack of professional training, many low-paid tourism-jobs go to local people while higher-paying and more prestigious managerial jobs go to foreigners or "urbanized" nationals.
Benefits of Sustainable coastal tourism
Economic benefits.
The main positive economic impacts of sustainable (coastal) tourism are: contributions to government revenues, foreign exchange earnings, generation of employment and business opportunities. Employing over 3.2 million people, coastal tourism generates a total of € 183 billion in gross value added and represents over one third of the maritime economy of the European Union. As much as 51% of bed capacity in hotels across Europe is concentrated in regions with a sea border [10] .
Contribution to government revenues Government revenues from the tourism sector can be categorised as direct and indirect contributions. Direct contributions are generated by income taxes from tourism and employment due to tourism, tourism businesses and by direct charges on tourists such as ecotax. Indirect contributions derive from taxes and duties on goods and services supplied to tourists, for example, taxes on tickets (or entry passes to any protected areas), souvenirs, alcohol, restaurants, hotels, service of tour operators.
Foreign exchange earnings Tourism expenditures, the export and import of related goods and services generate income to the host economy. Tourism is a main source of foreign exchange earnings for at least 38 % of all countries.
Employment generation The rapid expansion of international tourism has led to significant employment creation. Tourism can generate jobs directly through hotels, restaurants, taxis, souvenir sales and indirectly through the supply of goods and services needed by tourism-related businesses (e.g. conducted tour operators). Tourism represents around 7 % of the world’s employees. Tourism can influence the local government to improve the infrastructure by creating better water and sewage systems, roads, electricity, telephone and public transport networks. All this can improve the standard of living for residents as well as facilitate tourism.
Contribution to local economies Tourism can be a significant or even an essential part of the local economy. As environment is a basic component of the tourism industry’s assets, tourism revenues are often used to measure the economic value of protected areas. Part of the tourism income comes from informal employment, such as street vendors and informal guides. The positive side of informal or unreported employment is that the money is returned to the local economy and has a great multiplier effect as it is spent over and over again. The Global Sustainable Tourism Council (GSTC) estimates that tourism generates an indirect contribution equal to 100 % of direct tourism expenditures.
Direct financial contributions to nature protection Tourism can contribute directly to the conservation of sensitive areas and habitats . Revenue from park-entrance fees and similar sources can be allocated specifically to pay for the protection and management of environmentally sensitive areas. Some governments collect money in more far-reaching and indirect ways that are not linked to specific parks or conservation areas. User fees, income taxes, taxes on sales or rental of recreation equipment and license fees for activities such as hunting and fishing can provide governments with the funds needed to manage natural resources.
Competitive advantage More and more tour operators take an active approach towards sustainability. Not only because consumers expect them to do so but also because they are aware that intact destinations are essential for the long term survival of the tourism industry. More and more tour operators prefer to work with suppliers who act in a sustainable manner, e.g. saving water and energy, respecting the local culture and supporting the well-being of local communities. In 2000 the international Tour Operators initiative for Sustainable Tourism was founded with the support of UNEP. In 2014 it merged with the Global Sustainable Tourism Council (GSTC) .
Environmental Management and Planning benefits
Sound and efficient environmental management of tourism facilities and especially hotels (e.g.water and energy saving measures, waste minimization, use of environmentally friendly material) can decrease the environmental impact of tourism. Planning helps to make choices between the conflicting interests of industry and tourism, in order to find ways to make them compatible. Planning sustainable tourism development strategy at an early stage prevents damages and expensive mistakes, thereby avoiding the gradual deterioration of the quality of environmental goods and services significant to tourism.
Socio-cultural benefits
Tourism as a force for peace Travelling brings people into contact with each other. As sustainable tourism has an educational element it can foster understanding between people and cultures and provide cultural exchange between guests and hosts. This increases the chances for people to develop mutual sympathy, tolerance and understanding and to reduce prejudices and promote the sense of global brotherhood.
Strengthening communities Sustainable Coastal Tourism can add to the vitality of communities in many ways. For example through events and festivals of the local communities where they have been the primary participants and spectators. Often these are refreshed, reincarnated and developed in response to tourists’ interests. The jobs created by tourism can act as a very important motivation to reduce emigration from rural areas. Local people can also increase their influence on tourism development, as well as improve their jobs and earnings prospects through tourism-related professional training and development of business and organizational skills.
Revitalization of culture and traditions Sustainable Tourism can also improve the preservation and transmission of cultural and historical traditions . Contributing to the conservation and sustainable management of natural resources can bring opportunities to protect local heritage or to revitalize native cultures, for instance by regenerating traditional arts and crafts.
Encouragement social involvement and pride In some situations, tourism also helps to raise local awareness concerning the financial value of natural and cultural sites. It can stimulate a feeling of pride in local and national heritage and interest in its conservation. More broadly, the involvement of local communities in sustainable tourism development and operation seems to be an important condition for the sustainable use and conservation of the biodiversity .
Benefits for the tourists of Sustainable Tourism The benefits of sustainable tourism for visitors are plenty: they can enjoy unspoiled nature and landscapes, environmental quality of goods or services (clean air and water), a healthy community with low crime rate, thriving and authentic local culture and traditions.
Sustainable Tourism Strategy
The sustainable management of tourism is a complex managerial undertaking, requiring the involvement of multiple stakeholder groups, at local, regional and international levels. It entails a large set of actors and stakeholders, ranging from tour operators, industry associations and NGOs to local public authorities, businesses and independent small vendors. Indirectly, ‘producing holiday experiences’ involves entire communities and is subject to a multiplicity of motives, interests and perspectives [7] . In other words, the tourism economy consists of an entire network of institutional and business actors, that should be engaged in sustainable practices through rules and incentives.
Below a few steps are listed for the development and implementation of a strategy for sustainable tourism.
Analysis of status-quo
- Analysis of previous tourism management strategies for the specific area: What can be used? Has it been implemented? Which lessons are to be learnt?
- A stakeholder analysis: Who has an interest in sustainable tourism development? Who are the main actors?
- Facts and figures of the local educational system, economic and social structure
- Anecdotal and traditional knowledge
This information can be collected through
- Interviews with stakeholders
- Questionnaires distributed and collected by e-mail, fax or personally in order to compile standardised data and perform a statistical analysis
- Participation in focus group meetings (e.g. meetings on environmental education, biodiversity management, good governance and fisheries)
- Literature search (including the local library)
Strategy development
A Sustainable Tourism Strategy is based on the information collected. It defines the priority issues, the stakeholder community, the potential objectives and a set of methodologies to reach these objectives. These include:
- Conservation of specific coastal landscapes or habitats that make the area attractive or protected under nature conservation legislation
- Development of regionally specific sectors of the economy that can be interlinked with the tourism sector (e.g. production of food specialities and handicrafts)
- Maximising local revenues from tourism investments
- Enabling self-determined cultural development in the region, etc.
Action plan
The Action Plan describes the steps needed to implement the strategy and addresses a number of practical questions such as: which organizations will take up which activities, over what time frame, by what means and with which resources? As the actions have to be considered on the basis of regional circumstances, there is no standard action plan for all. However, Action Plans usually include measures in the following fields:
- Administration: e.g. promotion of co-operation between sectors and of cross-sectorial development models; involving local people in drafting tourism policy and decisions
- Socio-economical sector: e.g. promoting local purchasing of food and building material; setting up networks of local producers for better marketing; development of new products to meet the needs of tourists, etc.
- Environment: e.g. improving control and enforcement of environmental standards (noise, drinking water, bathing water, waste-water treatment, etc.); identification and protection of endangered habitats; creation of buffer zones around sensitive natural areas; prohibition of environmentally harmful sports in jeopardised regions; strict application of Environmental Impact Assessment (EIA) and Strategic Environmental Assessment procedures on all tourism related projects and programs
- Knowledge: training people involved in coastal tourism about the value of historical heritage; environmental management; training protected area management staff in nature interpretation; raising environmental awareness among the local population; introducing a visitors information programme (including environmental information)
Conclusions
During the last century, the role of beaches has completely reversed: they have become the driving force behind economic welfare instead of just being an inhospitable place. Demographic pressure, excessive land use and related factors, both in the hinterland (e.g. river dams, water diversion) and on the beach itself (e.g. hard coastal protection structures , sand/coral mining), have led to a general decrease in the contribution of sediments to the maintenance of the beaches and foreshores. It is hard to find a unique solution for all those problems. However, the following points are essential:
- The implementation of Integrated Coastal Zone Management
- A better dissemination of the existing information should be achieved. For that purpose, a better coordination of the existing governmental bodies that deal with coastal management is necessary
- Improvement of environmental education is a precondition for sustainable development of the coast
External links
https://www.gstcouncil.org/ The Global Sustainable Tourism Council (GSTC) is managing the GSTC Criteria, global standards for sustainable travel and tourism; as well as providing international accreditation for sustainable tourism Certification Bodies.
Internal Links
- Coastal pollution and impacts
- Threats to the coastal zone
- ↑ Dickhut, H. and Tenger, A. (eds.) 2022. Review and Analysis of Policies, Strategies and Instruments for Boosting Sustainable Tourism in Europe. European SME Going Green 2030 Report, p. 505
- ↑ https://www.f-cca.com/downloads/2018-Cruise-Industry-Overview-and-Statistics.pdf 2018 Cruise Industry Overview]
- ↑ Papathanassis, A. 2022. Cruise tourism. In D. Buhalis (ed), Encyclopedia of Tourism Management and Marketing. Cheltenham: Edward Elgar Publishing, pp. 687–690
- ↑ Moscovici, D. (2017) Environmental Impacts of Cruise Ships on Island Nations, Peace Review, 29: 366-373
- ↑ Caric, H. and Mackelworth, P, (2014) Cruise tourism environmental impacts – The perspective from the Adriatic Sea. Ocean & Coastal Management. 102: 350-363
- ↑ 7.0 7.1 Papathanassis, A. 2023. A decade of ‘blue tourism’ sustainability research: Exploring the impact of cruise tourism on coastal areas. Cambridge Prisms: Coastal Futures 1: 1–11
- ↑ Walker, K. and Moscardo, G. 2016. Moving beyond sense of place to care of place: The role of indigenous values and interpretation in promoting transformative change in tourists’ place images and personal values. Journal of Sustainable Tourism 24: 1243–1261
- ↑ International Tourism Highlights (2019) https://www.e-unwto.org/doi/pdf/10.18111/9789284421152
- ↑ Ecorys (2016) Study on specific challenges for a sustainable development of coastal and maritime tourism in Europe EC Maritime Affairs
- Articles by Lal Mukherjee, Abir
- Reviewed articles
- Integrated coastal zone management
- This page was last edited on 5 May 2023, at 17:28.
- Privacy policy
- About Coastal Wiki
- Disclaimers
Coastal Tourism

Description of coastal tourism:
Coastal tourism Gross Domestic Product is the total measure (in billions of dollars) of goods and services provided from tourism along the coast. U.S. coasts are host to a multitude of travel, tourism, and recreation activities. These provide social and economic benefits as well as impact the environment. As more and more communities turn to tourism for economic development, it becomes crucial to develop a sustainable tourism industry that is good for communities, the environment, and society more broadly. To accomplish this, we need data on the social and economic impacts of recreation and tourism, and its impacts on natural resources. We present the annual total change (in billions of dollars) of goods and services provided from tourism in the Gulf of Mexico, Mid-Atlantic, Northeast, Pacific Islands, Southeast, and California Current regions.
Coastal Tourism GDP data was taken from NOAA’s Office of Coastal Management Economics National Ocean Watch custom report building tool, with contextual data taken from the 2019 NOAA Report on the U.S. Ocean and Great Lakes Economy: Regional and State Profiles. Growth was estimated by subtracting the previous year’s Coastal Tourism GDP from the current year’s Coastal Tourism GDP, then dividing by the previous year’s Coastal Tourism GDP to present a percentage. All data was deflated to 2012 constant dollars using the Bureau of Economic Analysis’ chained dollar methodology.
kayaking icon

Description of time series:
The growth in the value of Alaska’s coastal tourism is relatively steady, with no clear trend and the last 5 years of growth not different from historical patterns.
Description of gauge:
The value of Alaska’s coastal tourism grew at a rate of 0.1% between 2015-2016, less than the rest of the regional economy’s growth of 8.4%, but more than other ocean sectors which saw a 14% decline over that same time period.
Description of Coastal Tourism:
Coastal tourism Gross Domestic Product is the total measure (in billions of dollars) of goods and services provided from tourism along the coast. U.S. coasts are host to a multitude of travel, tourism, and recreation activities. These provide social and economic benefits as well as impact the environment. As more and more communities turn to tourism for economic development, it becomes crucial to develop a sustainable tourism industry that is good for communities, the environment, and society more broadly. To accomplish this, we need data on the social and economic impacts of recreation and tourism, and its impacts on natural resources. We present the annual total change (in billions of dollars) of goods and services provided from tourism in the Gulf of Mexico, Mid-Atlantic, Northeast, Pacific Islands, Southeast, and California Current regions.
Extreme Gauge values:
A value of zero on the gauge means that the average coastal tourism over the last 5 years of data was below any annual coastal tourism level up until that point, while a value of 100 would indicate the average over that same period was above any annual coastal tourism level up until that point.
Coastal Tourism GDP data was taken from NOAA’s Office of Coastal Management Economics National Ocean Watch custom report building tool , with contextual data taken from the 2019 NOAA Report on the U.S. Ocean and Great Lakes Economy: Regional and State Profiles. Growth was estimated by subtracting the previous year’s Coastal Tourism GDP from the current year’s Coastal Tourism GDP, then dividing by the previous year’s Coastal Tourism GDP to present a percentage. All data was deflated to 2012 constant dollars using the Bureau of Economic Analysis’ chained dollar methodology.
Hawaii-Pacific Islands

The growth in the value of Hawaii’s coastal tourism varies considerably across time, although there is no clear trend and the last 5 years of growth is not different from historical patterns .
The value of Hawaii’s coastal tourism grew at a rate of 1.3% between 2015-2016, less than both the rest of the regional economy’s growth of 3.5% and other ocean sectors growth of 2.4% .
California Current

The growth in the value of coastal tourism within the California Current ecosystem varies considerably across time, although there is no clear trend and the last 5 years of growth is not different from historical patterns .
The value of coastal tourism within the California Current ecosystem grew at a rate of 1.3% between 2015-2016, less than the rest of the regional economy’s growth of 3.9%, but more than other ocean sectors which grew only 0.9% over that same time period .
Gulf of Mexico

The growth in the value of coastal tourism along the Gulf of Mexico varies considerably across time, with an upward trend although the last 5 years of growth shows no difference from historical patterns .
The value of coastal tourism along the Gulf of Mexico grew at a rate of 2.2% between 2015-2016, faster than the rest of the regional economy, which grew 0.2%, and other ocean sectors, which decreased 13.5% over that same time period .

The growth in the value of coastal tourism in the Southeast varies considerably across time, with no clear trend and the last 5 years of growth not different from historical patterns .
The value of coastal tourism in the Southeast grew at a rate of 0.1% between 2015-2016, less than both the rest of the regional economy, which grew 2.9%, and other ocean sectors, which grew 2.7% over that same time period.

The growth in the value of coastal tourism in the Northeast varies considerably across time, with no clear trend and the last 5 years of growth not different from historical patterns .
The growth in value of coastal tourism in the Northeast was mixed, with states north of New York seeing faster growth than both the regional economy and other ocean sectors, while states between New York and North Carolina seeing a decrease in GDP. Nevertheless, coastal tourism weathered recent economic downturns better than the regional economy as a whole .
Modal title
Indicator graphics.
Understanding the Gauge plots
The gauge plots that accompany the indicator time series are meant to reflect the current status of that ecosystem component, at the regional or national level. The numerical scores are determined as the percentile rank of the average (mean) value of that indicator over the last five years of the time series, relative to the series as a whole. The values typically represent quantitative score, with more desirable conditions in the darker blue. Thus, some gauges are "right-handed" with the higher values being in darker blue, whereas other gauges are "left-handed" with lower values being in darker blue (indicating that lower values are preferable). In some instances (e.g. climate measures), the scores represented are unitless and are presented as two-way gauges, indicating that either high or low scores are observed, implying neither higher nor lower values are necessarily preferred .

Lefthand gauge Righthand gauge Two-way gauge
Understanding the Time series plots
Time series plots show the changes in each indicator as a function of time, over the period 1980-present. Each plot also shows horizontal lines that indicate the median (middle) value of that indicator, as well as the 10th and 90th percentiles, each calculated for the entire period of measurement. Time series plots were only developed for datasets with at least 10 years of data. Two symbols located to the right of each plot describe how recent values of an indicator compare against the overall series. A black circle indicates whether the indicator values over the last five years are on average above the series 90th percentile (plus sign), below the 10th percentile (minus sign), or between those two values (solid circle). Beneath that an arrow reflects the trend of the indicator over the last five years; an increase or decrease greater than one standard deviation is reflected in upward or downward arrows respectively, while a change of less than one standard deviation is recorded by a left-right arrow.

Professional Association of Diving Instructors (PADI)
U.s. department of transportation, regional economy of fisheries (gdp) and percent regional economy dependent on fisheries: national ocean economics program, regional economy of fisheries (number of establishments, employments) and percent regional economy dependent on fisheries: national ocean economics program:, inventory of coastal recreation and tourism data, noaa economic national ocean watch data base.
The Economics: National Ocean Watch (ENOW) data set features time-series data focused on the six economic sectors that are dependent on the oceans and Great Lakes. ENOW is available for counties, states, regions, and the nation in a wide variety of formats.
- The Ocean’s Importance
What is the Ocean Panel?
Advisory Network
The Agenda: Transformations
Ocean Wealth
Ocean Health
Ocean Equity
Ocean Knowledge
Ocean Finance
Sustainable Ocean Plans
Progress Reports
Action Groups
Sustainable Coastal & Marine Tourism
- Publications

Coastal and marine tourism represents at least 50 percent of total global tourism . It constitutes the largest economic sector for most small island developing states and many coastal states. Securing the long-term sustainability and viability of this sector is critical for the continued prosperity of the destinations and communities that rely on it.
Featured Resources

Accessibility Tools
Privacy overview.
Coastal Tourism
- Pre-covid-19
10% of all international visitors that arrive in UK go to coast
The Coast comprises a very high rate of SMEs (with less than 3% corporate brands represented)
Coastal Tourism in England is highly seasonal, but change was happening as a result of investment in research, product development and marketing:

Key challenges facing coastal communities:
Seasonality
- Productivity
- Perceptions (consumers, media and government)
Climate Change – coastal storms / flooding Business ownership and investment
- Large number of micro and small businesses – difficult to coordinate and deliver change
- Prior to covid, 28% of businesses said they were “planning to sell / retire in next 5 years”
High dependency on Tourism average 15-20% of employment - but 50%+ in places like St. Ives, Exmoor, Whitby and Newquay
Socio-economic pressures on Coastal Communities Skills Brexit
But there are opportunities:
Addressing seasonality and attracting off peak growth markets
- International visitors
- Domestic visitors - Wellness, Slow tourism, Business Events, Under 35s, Empty nesters (over 55s) and Active Experiences
Wider sector or coastal opportunities…
- England Coast Path
Impact of Covid-19
Pre-COVID spend £13.7bn in England
2020 England – coastal impact of COVID-19
Based on July re-opening, loss of international travel and reduced capacity due to social distancing, November lockdown
Verified with National Business Survey data on capacity and revenue
- 95m trips and day visits
- £7.64bn loss in tourism spend
- Equivalent of circa 131,000 jobs
2021 England – coastal impact of COVID-19
Based on closure Jan-Mar, partial April reopening, very limited international travel, reduced capacity and busy summer
- 44m trips and day visits (-23% on pre-Covid-19)
- £5.15bn loss in tourism spend
- -37% on pre-Covid spend / 41% increase on 2020
Hotel Solutions forecast 20-25% of accommodation in coastal communities will close
Institute of Fiscal Studies - there “is no longer a north-south, or urban-rural divide… coastal areas are notably vulnerable to both the health and economic impacts of the crisis” – especially Isle of Wight, Torquay, Blackpool, Dorset and Northumberland
Other reports highlighting impact on coast
Centre for Towns, The Effect of the COVID-19 Pandemic on our Towns and Cities report 2020 Institute for Employment Studies, Labour Market Statistics June 2020: IES Analysis Social Markets Foundation Report HOPE not hate Charitable Trust, Understanding Community Resilience in Our Towns report 2020 Social Investment Business Group: Covid-19 Coastal Communities The Place Bureau Report
Domestic tourism on the Coast
South west is the most popular region for seaside visits:

Visitor Profile demographics:
Source:GBTS 2019
Socio-economic group
International visitors to the coast
10% visit the English coast at some point during their stay in UK
88% are on break of 4+nights (non coastal visitors = 55% on 4+ night break)

210,000 jobs worth £3.6bn (Sheffield Hallam University 2014) + 1% growth
Higher than average concentration of SMEs in coastal visitor economy
<3% corporate brands on the coast (National Coastal Tourism Academy 2015)
31% of residents work part-time → Net outflow of commuters (ONS 2014)
Contact details
+44(0)1202 093 429 [email protected]
- Travel, Tourism & Hospitality ›
- Leisure Travel
Coastal tourism in France - statistics & facts
Leisure activities, port infrastructure on all waterfronts, finding the balance between tourism and environmental issues, key insights.
Detailed statistics
Number of overnight stays on French coasts summer 2019
Number of recreational boats registered in French maritime waters 2021, by type
Editor’s Picks Current statistics on this topic
Travel, Tourism & Hospitality
Travel and tourism's total contribution to employment in France 2019-2034
Holiday Activities
Number of Blue Flag beaches in France 2022, by region
Number of recreational boats registered in French maritime waters 2022, by length
Further recommended statistics
Tourism industry in france.
- Premium Statistic Share of the GDP of the tourism sector in France 2014-2028
- Premium Statistic Number of international tourist arrivals in France 2014-2029
- Premium Statistic Overnight stays recorded in hotels in France monthly 2019-2020
- Premium Statistic Monthly overnight stays in hotels in France 2019-2024, by guest type
- Premium Statistic International tourism receipts per capita in France 2001-2029
- Premium Statistic Expenditure per capita on international tourism in France 2001-2029
- Premium Statistic Monthly revenue evolution of the hospitality industry in France 2019-2020
- Premium Statistic Monthly revenue evolution of the restaurant industry in France 2019-2020
- Basic Statistic Travel and tourism's total contribution to employment in France 2019-2034
Share of the GDP of the tourism sector in France 2014-2028
Share of the GDP of the tourism sector in France from 2014 to 2028
Number of international tourist arrivals in France 2014-2029
Number of international tourist arrivals in France from 2014 to 2029 (in millions)
Overnight stays recorded in hotels in France monthly 2019-2020
Number of overnight stays registered in hotels in France from 2019 to 2020, by month (in million)
Monthly overnight stays in hotels in France 2019-2024, by guest type
Number of monthly overnight stays in hotels in France from January 2019 to April 2024, by type of guest (in 1,000s)
International tourism receipts per capita in France 2001-2029
International tourism receipts per capita in France from 2001 to 2029 (in U.S. dollars)
Expenditure per capita on international tourism in France 2001-2029
Expenditure per capita on international tourism in France from 2001 to 2029 (in U.S. dollars)
Monthly revenue evolution of the hospitality industry in France 2019-2020
Revenue growth in the French hospitality sector from October 2019 to July 2020
Monthly revenue evolution of the restaurant industry in France 2019-2020
Turnover growth in the food service industry in France from October 2019 to July 2020
Travel and tourism's total contribution to employment in France 2019-2034
Total contribution of travel and tourism to employment in France in 2019 and 2023, with a forecast for 2024 and 2034 (in million jobs)
Overnight stays
- Premium Statistic Number of overnight stays on French coasts summer 2019
- Premium Statistic Change in domestic and international overnight stays on French coasts in summer 2019
- Premium Statistic Change in the overnight stays spent in hotels on the French coasts summer 2019-2020
- Premium Statistic Change in the hotel overnight stays on the French coasts summer 2019-2020, by region
- Premium Statistic Number of overnight stays on French coasts during the 2018-2019 winter season
- Premium Statistic Number of overnight stays on French coasts winter 2018-2019, by region
- Premium Statistic Number of overnight stays on French coasts during winter 2018-2019, by month
- Premium Statistic Number of overnight stays on French coasts winter 2018-2019, by origin
- Premium Statistic Change in domestic and international overnight stays on French coasts winter 2019
Number of overnight stays in coastal areas in France in summer from 2015 to 2019 (in millions)
Number of overnight stays in France in summer 2019, by coast (in millions)
Change in domestic and international overnight stays on French coasts in summer 2019
Percentage change in the number of overnight stays by domestic and international tourists in France between summer 2018 and summer 2019, by coast
Change in the overnight stays spent in hotels on the French coasts summer 2019-2020
Percentage change in the number of nights spent in coastal hotels in France between summer 2019 and summer 2020
Change in the hotel overnight stays on the French coasts summer 2019-2020, by region
Percentage change in the number of nights spent in hotels on the French coastlines between summer 2019 and summer 2020, by region
Number of overnight stays on French coasts during the 2018-2019 winter season
Number of overnight stays in coastal areas in France from winter season 2015-2016 to 2018-2019 (in millions)
Number of overnight stays on French coasts winter 2018-2019, by region
Number of overnight stays in coastal areas in France in winter 2018-2019, by region (in millions)
Number of overnight stays on French coasts during winter 2018-2019, by month
Number of overnight stays in coastal areas in France in winter 2018-2019, by month (in millions)
Number of overnight stays on French coasts winter 2018-2019, by origin
Number of overnight stays in coastal areas in France in winter 2018-2019, by origin (in millions)
Change in domestic and international overnight stays on French coasts winter 2019
Percentage change in the number of overnight stays in coastal areas in France between winter 2017-2018 and winter 2018-2019, by origin
Accommodation
- Premium Statistic Leading coastal towns with second homes France 2020
- Basic Statistic Number of second homes in France 2015, by region
- Basic Statistic Share of secondary homes in France 2015, by region
- Premium Statistic Tourist accommodation establishments in French coastal regions 2022
- Premium Statistic Hotel establishments in French coastal regions 2022
- Premium Statistic Campgrounds in French coastal regions 2022
- Premium Statistic Tourist residences in French coastal regions 2022
- Premium Statistic Vacation villages and family vacation homes in French coastal regions 2022
- Premium Statistic Youth hostels, international holiday and sports centers in France 2022
Leading coastal towns with second homes France 2020
Ranking of the cities in coastal areas with the most secondary residences in France in 2020
Number of second homes in France 2015, by region
Number of second homes in France as of January 1, 2015, by region
Share of secondary homes in France 2015, by region
Breakdown of secondary residences in France as of January 1, 2015, by region
Tourist accommodation establishments in French coastal regions 2022
Number of tourist accommodation establishments in coastal regions in France as of March 2022
Hotel establishments in French coastal regions 2022
Number of hotel establishments in coastal regions in France as of March 2022
Campgrounds in French coastal regions 2022
Number of campgrounds in coastal regions in France as of March 2022
Tourist residences in French coastal regions 2022
Number of tourist residences in coastal regions in France as of March 2022
Vacation villages and family vacation homes in French coastal regions 2022
Number of vacation villages and family vacation homes in coastal regions in France as of March 2022
Youth hostels, international holiday and sports centers in France 2022
Number of youth hostels, international holiday and sports centers in coastal regions in France as of March 2022
Seaside resorts
- Premium Statistic Leading French beach resorts 2018
- Premium Statistic Most expensive French beach resorts for one-week apartment rental during summer 2020
- Premium Statistic Cheapest beach resorts for a one-week apartment rental in France during summer 2020
- Premium Statistic Most expensive French beach resorts for one-week vacation home rental in summer 2020
- Premium Statistic Cheapest beach resorts for one-week vacation home rental in France during summer 2020
- Premium Statistic Coastal towns under 10,000 inhabitants the most searched on internet France 2021
Leading French beach resorts 2018
Ranking of the most popular beach resorts in France in 2018
Most expensive French beach resorts for one-week apartment rental during summer 2020
Ranking of the most expensive seaside resorts in France during August 2020, according to the price for a one-week apartment rental (in euros)
Cheapest beach resorts for a one-week apartment rental in France during summer 2020
Ranking of the least expensive seaside resorts in France during August 2020, according to the price for a one-week apartment rental (in euros)
Most expensive French beach resorts for one-week vacation home rental in summer 2020
Ranking of the most expensive seaside resorts in France during August 2020, according to the price for a one-week vacation home rental (in euros)
Cheapest beach resorts for one-week vacation home rental in France during summer 2020
Ranking of the least expensive seaside resorts in France during August 2020, according to the price for a one-week vacation home rental (in euros)
Coastal towns under 10,000 inhabitants the most searched on internet France 2021
Ranking of the coastal towns under 10,000 inhabitants the most searched on the Internet in France in 2021, by the average number of monthly requests
- Premium Statistic Number of Blue Flag beaches in France 2022, by region
- Premium Statistic Breakdown of the coastal water quality in France 2016-2021
- Premium Statistic Sea bathing water quality in France 2018, by region
- Premium Statistic Most expensive French beaches France 2018, by the average price for a day
- Premium Statistic Most expensive French beaches 2018, by setup costs
- Premium Statistic Most expensive French beaches 2018, by lunch price
Number of Blue Flag beaches in France in 2022, by region
Breakdown of the coastal water quality in France 2016-2021
Distribution of the water quality of coastal bathing sites in France from 2016 to 2021
Sea bathing water quality in France 2018, by region
Distribution of coastal bathing water with excellent quality in France in 2018, by region
Most expensive French beaches France 2018, by the average price for a day
Ranking of the most expensive beaches in France in 2018, by the average price for a day (in euros)
Most expensive French beaches 2018, by setup costs
Ranking of the most expensive beaches in France in 2018, by setup costs (in euros)
Most expensive French beaches 2018, by lunch price
Ranking of the most expensive beaches in France in 2018, by lunch price (in euros)
Recreational boating
- Premium Statistic Boat licenses issued to navigate at sea France 2020
- Basic Statistic Recreational boats registered in French maritime waters 2020, by region
- Basic Statistic Number of recreational boats registered in French maritime waters 2021, by type
- Premium Statistic Number of recreational boats registered in French maritime waters 2022, by length
- Premium Statistic Share of people who planned to go boating during summer in France 2019, by age
- Premium Statistic Berths in French maritime ports 2018, by maritime area
- Premium Statistic Maritime ports in France in 2018, by maritime area
- Premium Statistic Vessels using berths in French maritime ports 2018, by type of activities
- Premium Statistic Average price of berths France 2018, by maritime area
Boat licenses issued to navigate at sea France 2020
Number of boat licenses issued to navigate in maritime areas in France from 2008 to 2020
Recreational boats registered in French maritime waters 2020, by region
Total number of pleasure boats registered in maritime waters in France as of August 31, 2020, by region
Recreational boat registrations issued in mainland France as of August 31, 2021, by propulsion type
Number of recreational boats registered in French maritime waters as of August 2022, by length
Share of people who planned to go boating during summer in France 2019, by age
Percentage of French people planning to go boating this summer in 2019, by age
Berths in French maritime ports 2018, by maritime area
Number of berths in maritime ports in France in 2018, by maritime area
Maritime ports in France in 2018, by maritime area
Number of maritime ports in France in 2018, by maritime area
Vessels using berths in French maritime ports 2018, by type of activities
Distribution of boats using berths in maritime ports in France in 2018, by type of activities
Average price of berths France 2018, by maritime area
Average price per meter of berths in France in 2018, by maritime area (in euros)
Other water sports activities: sailing, surfing, diving
- Premium Statistic Number of licenses released by the Sailing Federation in France 2015-2019
- Premium Statistic Clubs of the Sailing Federation in France 2020, by region
- Premium Statistic Number of new and used sailboats sold in France 2017-2019
- Premium Statistic Number of licenses released by the Surfing Federation in France 2016-2019
- Premium Statistic Distribution of surfers by type of practice in France 2020
- Basic Statistic Surf clubs affiliated to the surfing federation in France 2020, by region
- Premium Statistic Number of licenses released by the Diving Federation in France 2015-2019
Number of licenses released by the Sailing Federation in France 2015-2019
Cumulative number of licenses and other titles of participation issued within the French Sailing Federation from 2015 to 2019
Clubs of the Sailing Federation in France 2020, by region
Number of clubs of the Sailing Federation in France in 2020, by region
Number of new and used sailboats sold in France 2017-2019
Number of new and used sailboats sold in France from 2017 to 2019
Number of licenses released by the Surfing Federation in France 2016-2019
Number of licenses and other titles of participation issued within the French Surfing Federation from 2016 to 2019
Distribution of surfers by type of practice in France 2020
Breakdown of surfers by type of practice in France in 2020
Surf clubs affiliated to the surfing federation in France 2020, by region
Number of clubs affiliated to the surfing federation in France in 2020, by region
Number of licenses released by the Diving Federation in France 2015-2019
Cumulative number of licenses and other titles of participation issued within the underwater studies and sports (Scuba diving) Federation from 2015 to 2019
Further reports
Get the best reports to understand your industry.
Mon - Fri, 9am - 6pm (EST)
Mon - Fri, 9am - 5pm (SGT)
Mon - Fri, 10:00am - 6:00pm (JST)
Mon - Fri, 9:30am - 5pm (GMT)
IMAGES
COMMENTS
The global coastal and maritime tourism market size was estimated at USD 2.9 trillion in 2021 and is expected to expand at a CAGR of 5.7% from 2022 to 2030, according to Grand View Research, Inc ... Historical data. 2017 - 2020. Forecast period. 2022 - 2030. Quantitative units. Revenue in USD billion and CAGR from 2022 to 2030.
1.0 Executive Summary: Key Findings. The Center for Ecotourism and Sustainable Development (CESD), a policy oriented research institute committed to providing analysis and tools for sustainable tourism development, was commissioned by the World Wildlife Fund (WWF) to assess the current trends and drivers behind coastal and cruise tourism. This ...
Tourism and Recreation
Sustainable-Tourism-Full-Report.pdf
Coastal tourism wage is the measure of wages (nominal) paid to employees in tourism industries along the coast. Data for Coastal Counties come from the US Census Bureau. This dataset represents US counties and independent cities which have at least one coastal border and select non-coastal counties and independent cities based on proximity to ...
The UN Tourism Data Dashboard - provides statistics and insights on key indicators for inbound and outbound tourism at the global, regional and national levels. Data covers tourist arrivals, tourism share of exports and contribution to GDP, source markets, seasonality and accommodation (data on number of rooms, guest and nights) ...
The Eurostat dataset 6 includes data on cruise passengers, including both those making stopovers and those starting or ending their cruise. However, this study does not consider expenses in the embarkation port such as hotel accommodations, restaurants (however it might be considered in standard coastal tourism economic impact assessment based on overnight stays).
The new realities have awakened a new approach to tourism, particularly from island and coastal nations. In 2020 the High Level Panel for a Sustainable Ocean Economy (Ocean Panel) set a goal of a sustainable tourism economy by 2030: "Coastal and ocean-based tourism is sustainable, resilient, addresses climate change, reduces pollution ...
With These Actions, Coastal and Marine Tourism can have ...
Over 350 million people annually travel to the coral reef coast of the world. The coral reef tourism sector is has an estimated annual value of $36 billion. Over 70 countries and territories have "million dollar reefs" — reefs that generate over $1 million in tourism spending annually. 600,000 people have been estimated to spend over US ...
Marine ecotourism is a subsector of ecotourism and conforms to the core criteria of sustainable tourism, implying a responsible travel to natural areas that helps in conserving the environment, sustaining the well-being of the local people, and imparting an educational experience. Marine ecotourism can be land-based in coastal areas or in the sea and can achieve the sustainability objectives ...
Impact of tourism in coastal areas: Need of sustainable ...
Pacific Marine and Coastal Tourism. Date modified: 11 February 2022. Fact Sheet - Pacific tourism depends on healthy marine ecosystems for aesthetic appeal and for the ecosystem services that support human occupation. This fact sheet links it to SDGs and brief background info on how the Pacific island countries face challenges in planning for ...
Coastal Tourism GDP data was taken from NOAA's Office of Coastal Management Economics National Ocean Watch custom report building tool, with contextual data taken from the 2019 NOAA Report on the U.S. Ocean and Great Lakes Economy: Regional and State Profiles. Growth was estimated by subtracting the previous year's Coastal Tourism GDP from ...
tourism. literature review. meta-evaluation. 1. Introduction. The main goal of this paper is to gather and critically examine empirical evidence on how Climate Change (CC) impacts coastal and maritime tourism. This is done through a review and meta-evaluation of the literature of the last twenty years (2000-2019).
ed findings.3.2.3 State and Regional Data GapsAt the state and regional levels, there were two primary categories of data gaps, including: 1) datasets for environmental impacts resulting from coastal tourism and recreation, and 2) data on certain types of recr. ational activity preferences and participation. Belo.
Sustainable Coastal & Marine Tourism - Ocean Panel
Data Source: Coastal Tourism GDP, employment, and real wage data was taken from NOAA's Office of Coastal Management Economics: National Ocean Watch (ENOW) custom report building tool, with contextual data taken from the 2020 NOAA Report on the U.S. Marine Economy: Regional and State Profiles. Growth was estimated by subtracting the previous ...
Abstract. For many coastal regions, marine and coastal tourism is a vital contributor to their economies. However, recent COVID-19 related travel restrictions have constrained the flow of overseas ...
Climate is an essential component in the sustainability of tourism cities. Coastal tourism cities face unprecedented challenges under a changing climate. The complexity of the tourism-climate interface predicates the need for tools that can assess the weather and climate accurately. Tourism climate indices have been widely developed to evaluate the temporal and spatial distribution of ...
Coastal Tourism in Great Britain: Generated £17.1bn tourism spend. 27m overnight visits, 217m day visits. Supported 285,000 tourism related jobs. 10% of all international visitors that arrive in UK go to coast. The Coast comprises a very high rate of SMEs (with less than 3% corporate brands represented) Coastal Tourism in England is highly ...
Coastal tourism in France - statistics & facts. Although the coastline represents only four percent of the French metropolitan area, it is nonetheless a key space for the tourism industry in ...