How-To Geek
How to turn on the develop menu in safari on mac.
The Develop menu lets you view page source in Safari on Mac.

Quick Links
How to enable the develop menu in safari on mac, how to view page source in safari on mac.
When you right-click on any web page in Safari on Mac, it doesn't reveal the Show Page Source and Inspect Element buttons. To see these, you need to enable the Develop menu---we'll show you how to do that.
Once you've enabled the Develop menu, right-clicking a blank space on any website will reveal the Inspect Element and Show Page Source buttons. These allow you to take a look at the source code of any website, which is useful for things like downloading images from websites and debugging code or finding out what it looks like behind any site (for website designers).
You can easily turn on the Develop menu in Safari by following a couple of steps. Open Safari on your Mac and click the "Safari" button in the menu bar.
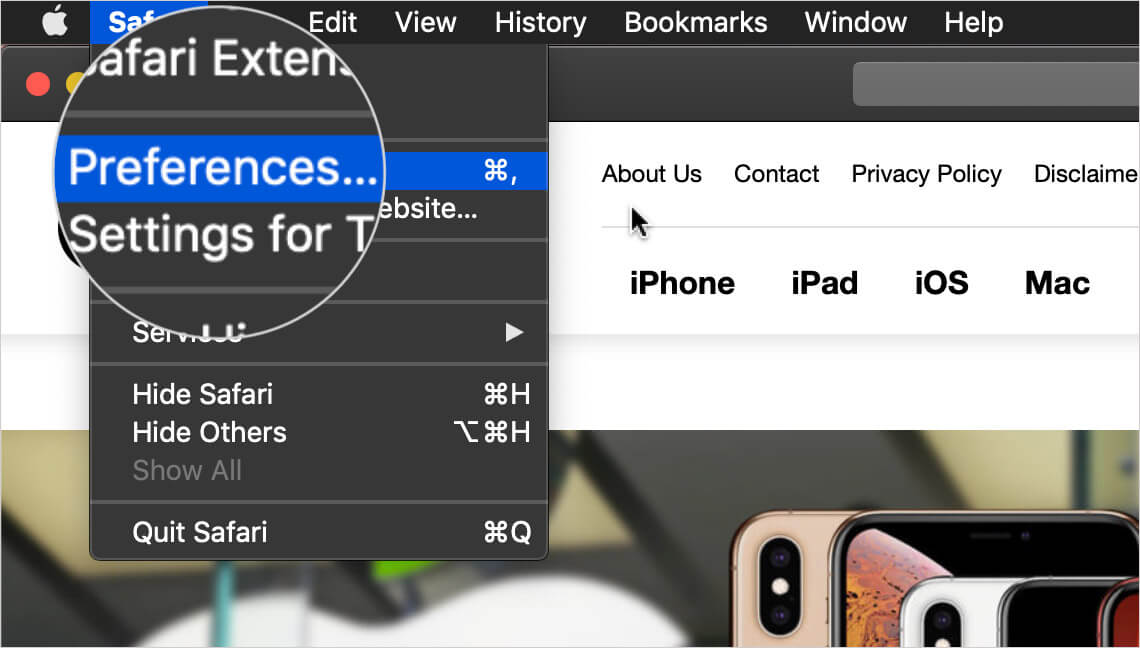
Next, select "Preferences." Alternatively, you can use the keyboard shortcut Command+, (comma). This will also open up Safari preferences.
Go to the "Advanced" tab.
Check the box for "Show Develop Menu in Menu Bar."
Now the Develop menu will appear between Bookmarks and Window at the top.
Apart from being able to view the page source, this will allow you to access developer-focused features, such as disabling JavaScript on any website.
Once you've enabled the Develop menu, there are a couple of ways to view the page source in Safari.
Open any website in Safari and right-click the blank space on the page. Now, select "Show Page Source." You can also get to this menu by using the keyboard shortcut Option+Command+u.
If you're looking for images or other media elements from any web page, Safari makes it easy to find these. In the left-hand pane, you will see various folders such as Images, Fonts, etc. Click the "Images" folder to quickly find the photos that you need.
After selecting an image, you can view its details easily by opening up the details sidebar. The button to open this is located at the top-right of the console, just below the gear icon. You can also open this with the shortcut Option+Command+0.
Click "Resource" at the top of the details sidebar to view details, such as the size of the image and its full URL.
You can change the position of the page source console easily, too. There are two buttons at the top-left of this console, right next to the X button. Click the rectangle icon to move the console to a different side within the browser window.
If you'd like to open the page source console in a separate window, you can click the two-rectangles icon. This will detach the console and open it in a separate window.
To check out the code for any specific element on the page, you can right-click that element and select "Inspect Element." This will take you directly to the code for the element that you selected.
Whenever you're done looking at the code, click the X button to close the page source console and return to browsing on Safari. You can also check out how to view a website's page source in Google Chrome here.
Related: How to View the HTML Source in Google Chrome
Safari User Guide
- Change your homepage
- Import bookmarks, history, and passwords
- Make Safari your default web browser
- Go to websites
- Find what you’re looking for
- Bookmark webpages that you want to revisit
- See your favorite websites
- Use tabs for webpages
- Pin frequently visited websites
- Play web videos
- Mute audio in tabs
- Pay with Apple Pay
- Autofill credit card info
- Autofill contact info
- Keep a Reading List
- Hide ads when reading articles
- Translate a webpage
- Download items from the web
- Share or post webpages
- Add passes to Wallet
- Save part or all of a webpage
- Print or create a PDF of a webpage
- Customize a start page
- Customize the Safari window
- Customize settings per website
- Zoom in on webpages
- Get extensions
- Manage cookies and website data
- Block pop-ups
- Clear your browsing history
- Browse privately
- Autofill user name and password info
- Prevent cross-site tracking
- View a Privacy Report
- Change Safari preferences
- Keyboard and other shortcuts
- Troubleshooting
Use the developer tools in the Develop menu in Safari on Mac
If you’re a web developer, the Safari Develop menu provides tools you can use to make sure your website works well with all standards-based web browsers.
If you don’t see the Develop menu in the menu bar, choose Safari > Preferences, click Advanced, then select “Show Develop menu in menu bar.”
Open Safari for me
- Web Browser
- Google Chrome Browser
- Mozilla Firefox Browser
- Microsoft Edge Browser
- Apple Safari Browser
- Tor Browser
- Opera Browser
- DuckDuckGo Browser
- Brave Browser
- Basic and advance shortcut keys in Apple Safari Browser
- Hidden tricks inside Apple Safari Browser
- Bookmark in Apple Safari Browser
- Architecture of Apple Safari Browser
- Apple to Launch Search Engine to Rival Google
Safari for Developement
- DevTools in Apple Safari Browser
Developer Mode in Safari Browser
- Debugger In Apple Safari Browser
Safari Tabs
- Console Tab in Safari Browser
- Sources Tab in Apple Safari Browser
- Storage Tab in Apple Safari Browser
- Elements Tab in Apple Safari Browser
- Network Tab in Apple Safari Browser
- Web Capture Tabs in Apple Safari Browser
How to .. in Safari
- How to enable or disable split view in Apple Safari Browser ?
- How to disable or enable auto-play videos in Apple Safari Browser ?
- How to Allow Pop-Ups in Safari?
- How to use Safari for web development
- How to use inspect element in Chrome, Firefox and Safari ?
- How to Browse in Apple Safari Browser ?
The Safari developer mode consists of a suite of tools meant to help web developers design, troubleshoot, and speed up their websites and Web apps. These functions contribute towards refining web development by incorporating measures that can be used to examine, revise, or evaluate web content.
The bulk of Safari Developer Mode is composed of Safari Web Inspector. This toolset functions as an entrance to numerous capabilities including accessing and modifying the heart of web page attributes such as the HTML structure for websites, CSS stylesheets, javascript functionalities, webpage performance, and debugging possibilities.
Table of Content
Benefits of Safari Developer Mode
- How to open safari developer mode
- Various options available in Developer mode
Example Showing Usage
The usage of Safari Developer Mode offers an array of benefits to developers and web development teams:
- Efficient Debugging: You can pinpoint, fix, and understand issues from the heart of a page’s components.
- Performance Optimization: Optimization of loading times by analyzing and restructuring network requests.
- Real-time Testing and Modification: Enabled real-time changes and testing that support faster development steps.
- Device Emulation: Help in producing responsive designs by simulating and imagining how the site looks on different devices.
- Responsive Design Mode: This is an app that mimics what a page looks like on different screen sizes of mobile devices across multiple orientations. It helps in creating responsive design and checking a website’s performance on various gadgets.
How to open safari developer mode:
Activating Safari Developer Mode requires a few simple steps:
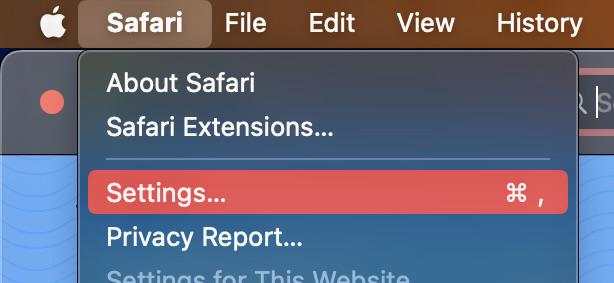
openning safari settings
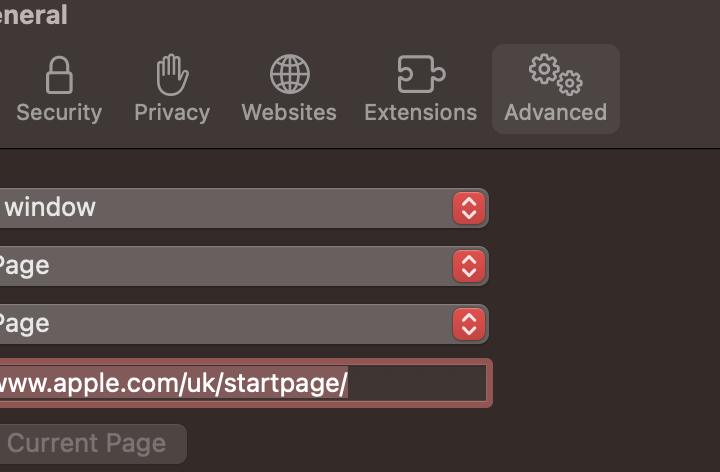
open advanced

Develop menu
- Open the Web Inspector: Go to Develop, click on “ Show Web Inspector. ”
Various options available in Developer mode:
Here are some of the key tools available in the developer mode of Safari browser:
The Inspector tool allows developers to examine and modify the Document Object Model (DOM) of a webpage. This helps in understanding the structure of the HTML and CSS, as well as making real-time changes to see their effects.
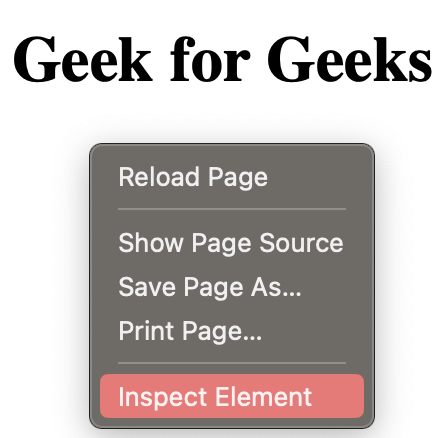
Inpecting Web page
The Console provides a JavaScript console for developers to log information, execute JavaScript code, and catch errors. It is a valuable tool for debugging scripts and testing code snippets.
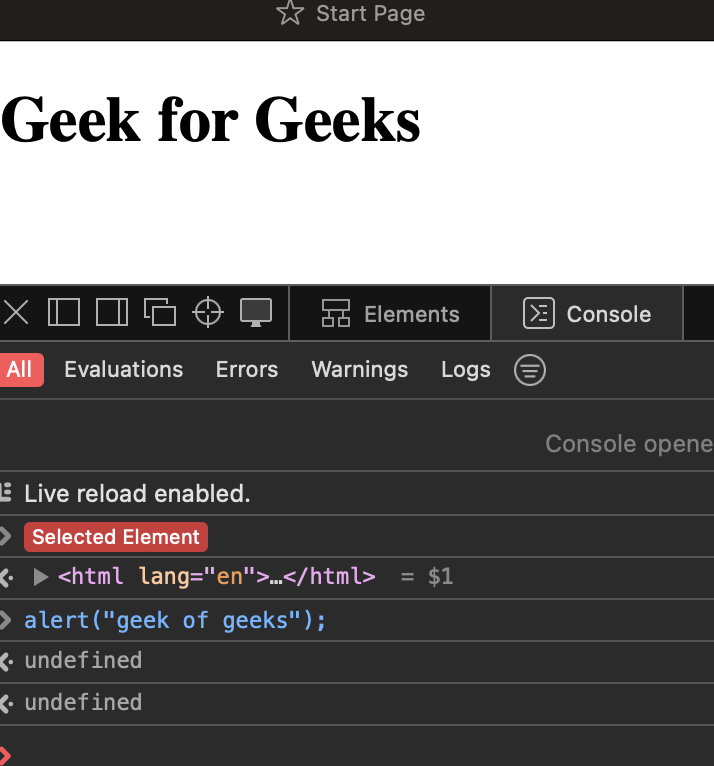
Console mode
This panel is an extension of the Inspector tool, providing a detailed view of the HTML and CSS elements on the page. Developers can modify styles, attributes, and content directly within this panel.
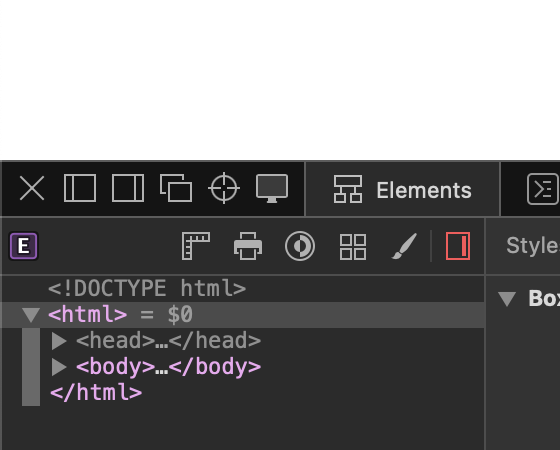
Elements tab
The Sources panel allows developers to debug JavaScript code. It includes features like breakpoints, stepping through code, and watching variables, helping developers identify and fix issues in their scripts.
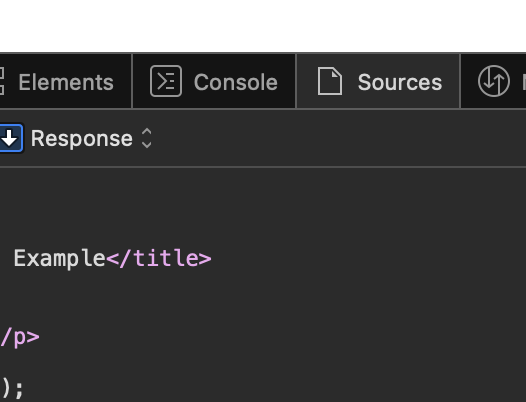
Sources tab
The Network panel provides insights into the network activity of a webpage, showing details of all resources loaded, their sizes, and loading times. This is crucial for optimizing page performance.
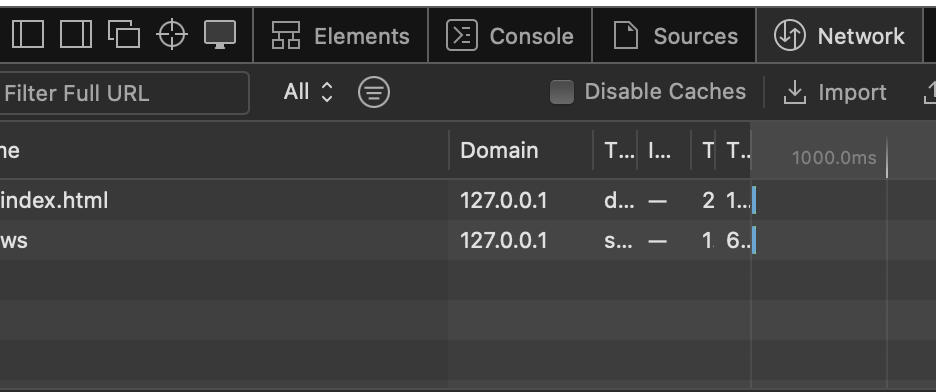
Network tab
The Timeline tool records and visualizes various events on a webpage, such as script execution, rendering, and painting. This helps developers identify performance bottlenecks and optimize their code.
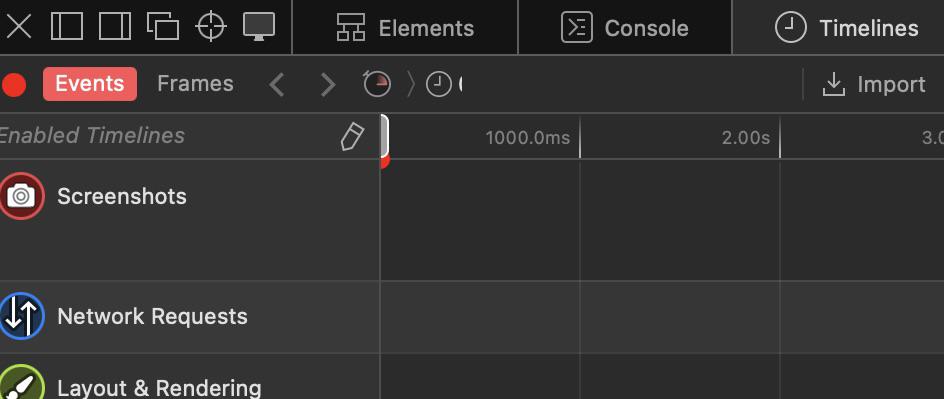
Timelines tab
The Storage panel allows developers to inspect and modify data stored by the website, including cookies, local storage, and session storage. This is useful for debugging and testing how a website handles data storage.
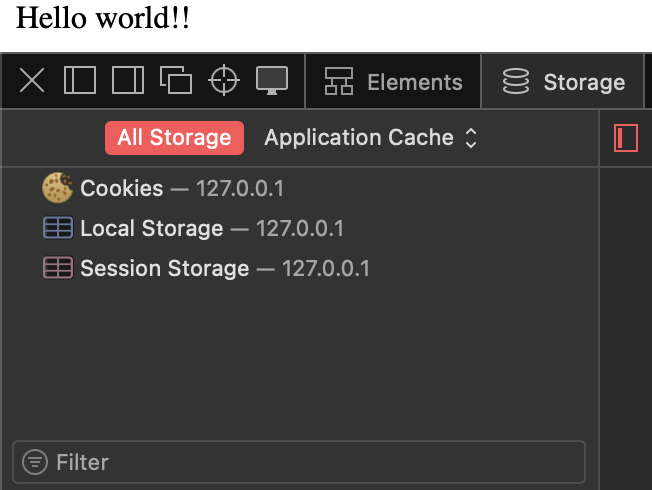
Storage tab
Now, let us look at a particular scenario where we will fix a problem with a web page using Safari Developer Mode. Imagine a case where the layout of a website gets altered because it has a problem relating to CSS style. The web inspector allows a person to pick out the bad part, inspect and fix the CSS properties in real time. Here’s a image showcasing this process:
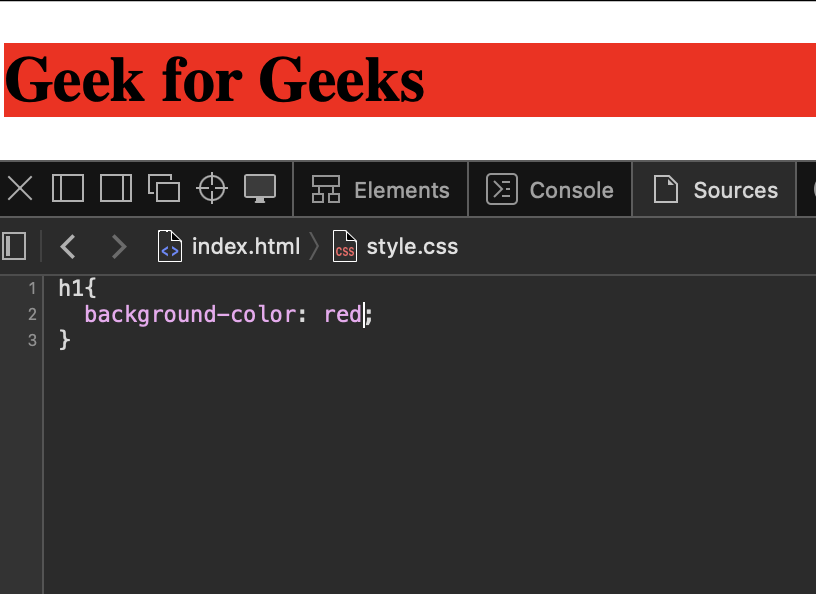
Web developers rely on Safari Developer Mode; it is a great tool with multiple features and functions vital for effective web development. For web developers, the Safari Developer Mode equipped with the Web Inspector forms an amazing partner that possesses a toolbox for creating, debugging, and optimizing websites. It goes through HTML, CSS, JavaScript, network performance, as well as responsive design. The suite facilitates convenient debugging, live testing, and diverse instrumentation. This touches on project development starting right at its conception, incorporating quality and responsiveness aspects in design. In brief, it is a point of reference for making beautiful and fast websites even at this digital world.
Please Login to comment...
Similar reads.

- Apple Safari
- Geeks Premier League 2023
- Geeks Premier League
- Web Browsers
- 10 Ways to Use Slack for Effective Communication
- 10 Ways to Use Google Docs for Collaborative Writing
- NEET MDS 2024 Result: Toppers List, Category-wise Cutoff, and Important Dates
- NDA Admit Card 2024 Live Updates: Download Your Hall Ticket Soon on upsc.gov.in!
- 30 OOPs Interview Questions and Answers (2024)
Improve your Coding Skills with Practice
What kind of Experience do you want to share?

How to Enable Develop Menu in Safari on Mac: Unleash the Developer Within You

If you are a developer or an advanced Internet surfer, Develop menu on Safari unlocks a lot of tweaks. Starting with Inspector and error consoles to Do Not Track feature, all are pretty straightforward to use. The menu is hidden by default on Mac. But it is extremely easy to enable Develop menu in Safari using app’s preferences.
In addition to that, the Develop menu also has certain experimental features that you can try your hands on. To learn how to enable it, follow this short and quick guide and get started.
How To Show in Develop Menu in Safari on Mac
Step #1. Open Safari on your Mac.
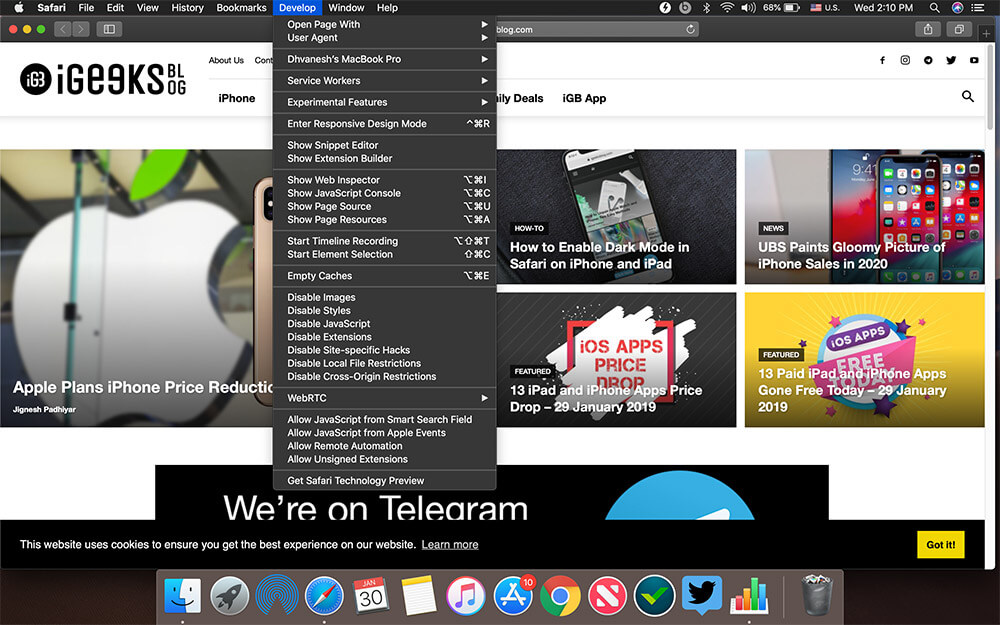
Step #2. Now click Safari on the Menu bar and then click on Preferences…
Step #3. In Safari Preferences, click on Advanced tab.
Step #4. All you need to do now is to check the box beside “Show Develop menu in menu bar” option.
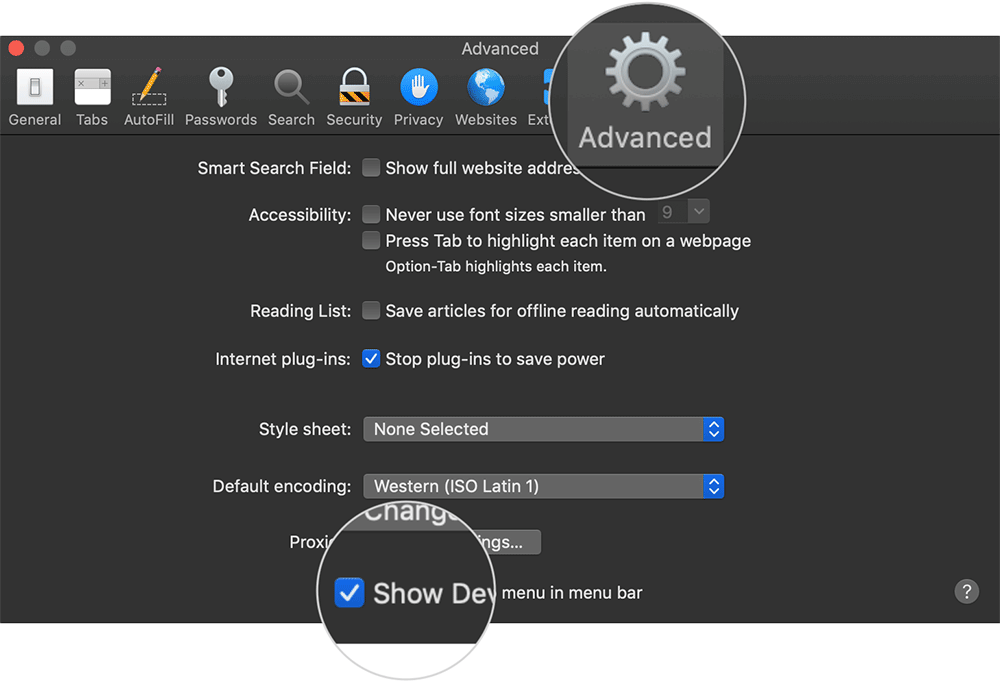
That’s all. You can exit the preferences and notice that Develop menu is now visible beside Bookmarks.
Signing off…
I find the Develop menu extremely useful as it comes in handy to troubleshoot common website problems. It lets me debug javascript error, console errors, and many other things.
The most impressive feature is to enable Do Not Track mode. This stops websites from tracking my browsing and then shooting me with ads. What’s your favorite feature on the develop menu?
Related articles:
- 4 Reasons Why Safari is Better Than Any Other Browser
- Best Netflix Extensions for Safari, Chrome, and Firefox
- How to Enable Dark Mode in Safari on iPhone and iPad
- How to update Safari on Mac
Do you use Develop menu on Safari? What’s the primary purpose? Share your insights in the comments.
🗣️ Our site is supported by our readers like you. When you purchase through our links, we earn a small commission. Read Disclaimer .
Leave a Reply Cancel reply
Your email address will not be published. Required fields are marked *
Save my name, email, and website in this browser for the next time I comment.
- Artificial Intelligence
- Generative AI
- Cloud Computing
- Computers and Peripherals
- Data Center
- Emerging Technology
- Augmented Reality
- Enterprise Applications
- IT Leadership
- IT Management
- Remote Work
- IT Operations
- Operating Systems
- Productivity Software
- Collaboration Software
- Office Suites
- Vendors and Providers
- Enterprise Buyer’s Guides
- United States
- Netherlands
- United Kingdom
- New Zealand
- Newsletters
- Foundry Careers
- Terms of Service
- Privacy Policy
- Cookie Policy
- Copyright Notice
- Member Preferences
- About AdChoices
- E-commerce Affiliate Relationships
- Your California Privacy Rights
Our Network
- Network World

How to use the Safari Develop Menu on a Mac
Control caches, check website performance, and get better website responses with these simple tools..
It may be aimed at developers but most Mac users should spend a little time getting to know Safari’s Develop Menu. This is because it provides tools most Mac users will need from time to time.
What is the Safari Develop Menu?
Because most of the tools offered within the menu are aimed at Web developers, you don’t see Safari Develop Menu by default.
To use it you must enable it in Safari Preferences. Click on the Advanced tab and check the box beside the phrase “Show Develop menu in menu bar” at the bottom of the pane. You will now see a new Menu item appear between your Bookmarks and Windows menus.
Most Mac users won’t need to make use of all the tools it provides, but what follows are some tasks most Mac users may find useful from time-to-time. You can find out more about the other tools it provides here .
You can empty Safari caches
If your Safari browser becomes slow or some websites fail to load it is possible that cache files have become corrupted. These files contain website data such as images and templates and are collected by Safari in an attempt to speed up page load times. Use the ‘Empty Caches’ command to get rid of this data, which may sometimes improve browser performance.
You can swiftly launch websites in different browsers
If you visit a website that doesn’t seem to want to work with Safari because some web designer failed to read the memo that explains how the Internet is built using shared standards, then you can quickly launch that site using another browser you may have installed on your Mac. Just choose ‘Open Page With’ and select the alternate browser you would like to use.
You can pretend to be using a different browser
It’s quite useful to be able to open a stubborn page in an alternate browser, but you can also try to convince websites that you are already using a different browser using Safari Develop Menu.
Select ‘User Agent’ and you will see a drop down menu listing a range of alternate desktop and mobile browsers including Safari, Internet Explorer, FireFox and Chrome.
Select one of these and Safari will try to convince the website you are trying to visit that it is one of these alternate browses by sending a different user agent.
(The user agent is a string of text your browser sends that lets the site know which browser you are using). This doesn’t always work but you’ll often find sites that claim not to support Safari actually do, once you use this trick.
You can figure out why some sites suck system resources
If you’ve ever visited a website that is poorly engineered with lots of orphaned code or what not then you may have seen that site impact your whole web browser. Eventually you need to restart it. That’s not such a big deal but it is annoying.
If you think you have come across such a site you can get the evidence you need:
- Just visit the site and choose Start Timeline Recording.
- Hit refresh and you’ll see a visual real time representation of what happens when you try to load that website.
- Or use Web Inspector to see all those elements in one place or to identify image/video files on a site.
You can see what a site looks like on an iPhone
Just choose ‘Enter Responsive Design Mode’ and you can take a look at how the site you are on looks on different Apple devices.
One more thing
Safari also boasts a hidden debug menu. You access this using a Terminal script. It provides a range of useful commands, including the capacity to ‘Reset your Top Sites’, ‘Synch your iCloud History’ and to see all the resources used by any website you happen to be one. Here is what you need to know about the debug menu.
Google+? If you use social media and happen to be a Google+ user, why not join AppleHolic’s Kool Aid Corner community and join the conversation as we pursue the spirit of the New Model Apple?
Got a story? Drop me a line via Twitter or in comments below and let me know. I’d like it if you chose to follow me on Twitter so I can let you know when fresh items are published here first on Computerworld.
Related content
Jamf brings powerful new compliance tools to apple it, yes, apple’s vision pro is an enterprise product, apple's find my system is coming to android, india is about to become apple's third-biggest market, from our editors straight to your inbox.

Hello, and thanks for dropping in. I'm pleased to meet you. I'm Jonny Evans, and I've been writing (mainly about Apple) since 1999. These days I write my daily AppleHolic blog at Computerworld.com, where I explore Apple's growing identity in the enterprise. You can also keep up with my work at AppleMust , and follow me on Mastodon , LinkedIn and (maybe) Twitter .
Most popular authors
- Howard Wen Contributing Writer

Show me more
18 ways to speed up windows 10.

Google adds a premium option for Chrome Enterprise

Google Workspace gets new genAI pricing options, Vids app

Voice cloning, song creation via AI gets even scarier

The link between smartphones and social media addiction

Sam Bankman-Fried gets 25 years in prison

How to Access Console in Safari Browser on Mac
Debugging web pages or working with JavaScript requires access to the browser’s developer tools, often referred to as the “console.” In Safari on a Mac, accessing the console can be slightly different than on other browsers like Chrome or Firefox.
This blog post provides a detailed guide on how to open and use the console in Safari.
Why Access the Console?
Before diving into the steps, let’s look at some reasons you might want to use the console:
- Debugging : It helps in identifying issues with web pages or scripts.
- Monitoring : You can watch network activity and other events in real time.
- Testing : The console lets you run JavaScript commands and see their effects instantly.
Prerequisites
To follow this guide, you’ll need:
- A Mac computer running macOS.
- The Safari browser installed.
Enable Developer Mode
In Safari, the console is a part of the developer tools, which are not visible by default. To enable them:
Step 1: Open Safari Settings
Go to Safari > Settings or press Command + , to open the Preferences panel.
Step 2: Unlock the Advanced Tab
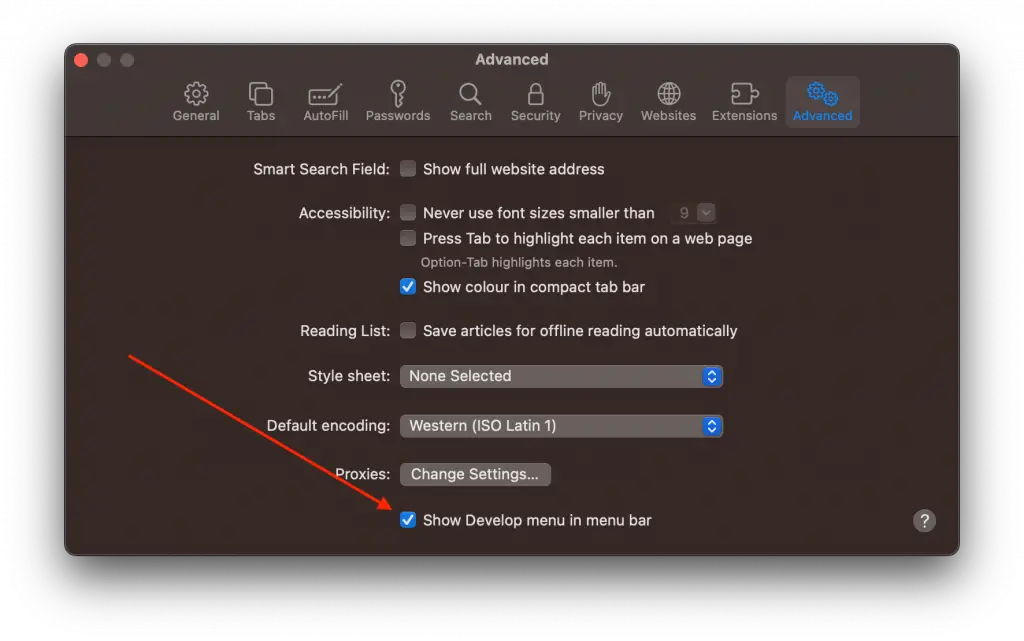
Navigate to the ‘Advanced’ tab.
Step 3: Enable Developer Menu
At the bottom, you’ll find the option “Show Develop menu in menu bar” Check this box.
Access the Console
Once Developer Mode is enabled, you’ll see a new ‘Develop’ option in the Safari menu bar.
Step 1: Open the Web Inspector
Go to Develop > Show Web Inspector or simply press Command + Option + I .
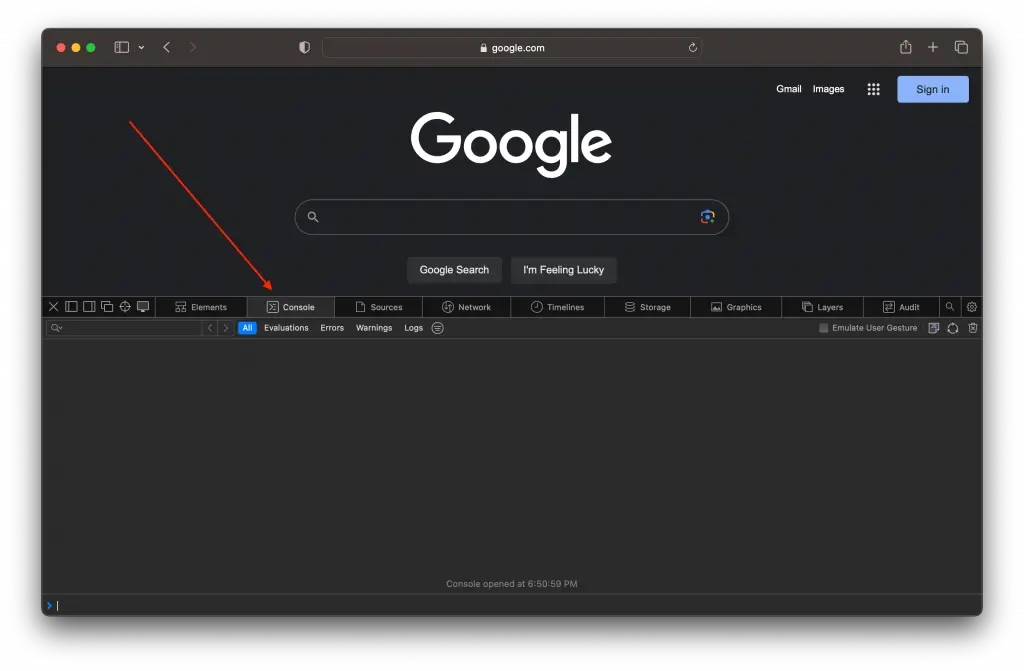
Step 2: Navigate to Console Tab
Inside the Web Inspector, you will see multiple tabs like ‘Elements,’ ‘Console,’ ‘Sources,’ etc. Click on the ‘Console’ tab.
Step 3: Interact with the Console
Here you can type JavaScript commands, check errors, and view logs.
Using the Console
The console in Safari has several useful features:
- Autocomplete : As you type, Safari will suggest possible completions.
- Command History : Use the up and down arrows to navigate through past commands.
- Clear Console : Click the ‘Clear’ button or type clear() to remove existing messages.
Advanced Tips
- Preserve Log : To keep the log when you navigate to a different page, click the ‘Preserve Log upon Navigation’ button (a box icon).
- Filter Messages : Use the filter box to search through existing console messages.
Accessing the console in Safari on a Mac is a simple yet powerful way to interact with web pages and run JavaScript commands. Enabling Developer Mode and familiarizing yourself with the console can offer valuable insights into web development and debugging tasks.
Professionally, I am a software developer. I am also a tech enthusiast and always curious about operating systems, softwares, internet and apps.
Similar Posts

How to Enable Cookies in Safari Browser on Mac
Cookies are small pieces of data that websites store on your device to remember your preferences, login information, and more. While cookies can be a point of concern for privacy, they’re often essential for a fully functional web experience. If you find that certain websites aren’t working correctly or you can’t log in, it may…

How to Convert Video to Audio on Mac
Extracting audio from a video file can be a helpful way to listen to a movie, speech, or music video without having to watch it. While there are numerous tools available for this purpose, this blog post focuses on various methods to convert video to audio on a Mac. This guide will cover using QuickTime…


How to Create Safari Web Apps on Mac: A Simple Guide
With the introduction of macOS Sonoma, Safari now allows you to save any webpage as a web app. This offers a more app-like experience and easy access right from your Mac’s Dock. In this concise guide, we’ll cover how web apps differ from regular webpages, how to create one and tweak its settings. How Does…

Why is the ‘Clear History’ Button in Safari Greyed Out on Mac
Have you ever wanted to clear your Safari browsing history on your Mac, only to find that the ‘Clear History’ button is greyed out? This can be both confusing and frustrating, especially when you want to ensure your privacy or resolve some website issues. In this blog post, we’ll explore why this happens and how…

How to Close All Tabs in Safari Browser on Mac
Navigating the web often results in accumulating a large number of open tabs in your browser, which can clutter your workspace and slow down your system. If you’re using Safari on a Mac, closing all tabs simultaneously can be a big timesaver and help you declutter. This blog post will guide you through various methods…

How to Manage Safari Browser Autofill on Mac
The Safari browser’s Autofill feature is a time-saver for everyone from online shoppers to research enthusiasts. Yet, despite its conveniences, the feature comes with security implications that can’t be ignored. This comprehensive guide delves into what Safari’s Autofill is, how to set it up, manage it, and what to be cautious about. What is Safari…
One Comment
- Pingback: How to Inspect Element in Safari on Mac - MacLifePro
Leave a Reply Cancel reply
Safari Dev Tools: The Complete 2023 Guide
Introduction to safari developer tools.
Safari is Apple's proprietary web browser that comes pre-installed on all Mac and iOS devices. Its integrated developer tools provide everything web developers need to build, debug and optimize websites for Apple's ecosystem.
In this comprehensive tutorial, we'll cover key capabilities of Safari's dev tools including:
- The Web Inspector for inspecting page structure and CSS
- The Debugger for stepping through JavaScript code
- The Resources panel for auditing page assets
- The Audits panel for testing web standards compliance
- Device Mode for simulating mobile screens
- Advanced debugging features like conditional breakpoints
- Network throttling to simulate real-world conditions
- Experimental features for early access
By the end, you'll have master expertise using Safari dev tools to squash bugs faster, improve site performance, and deliver exceptional web experiences across Apple devices. You'll also discover resources like DevHunt to continue exploring the latest Safari developer tools.
A Brief History of Safari
Safari originated within Apple in 2003, based on the open source KHTML rendering engine. It was first released for Mac OS X Panther and quickly became Apple's default browser.
In 2007, Apple launched the first Windows version of Safari to expand its userbase. That same year, Safari made its mobile debut on the first iPhone.
Over the years, Safari has gone through many major version updates adding new features and support for emerging web standards. It remains the pre-installed browser on all Apple operating systems and devices including Macs, iPhones and iPads.
Why Learn Safari Developer Tools?
Here are some key reasons web developers should learn Safari dev tools:
- Pre-installed on all Mac and iOS devices, used by millions globally
- Allows direct debugging on iOS devices
- Can emulate mobile devices in desktop browser
- Essential for targeting Apple's ecosystem
- Identify optimizations for Safari to improve site experience
- Learn how your sites perform on Safari and make improvements
- Fix rendering issues specific to WebKit browser engine
- Utilize experimental features to build cutting-edge websites
- Discover new Safari dev tools on platforms like DevHunt
With Safari holding significant browser market share, especially in the mobile space, having expertise in its developer tools is vital for crafting high-quality cross-browser experiences.
Core Safari Developer Tools
Now let's dive into the core developer tools available within Safari on both desktop and mobile.
The Web Inspector
The Web Inspector is the main hub for visually inspecting and modifying a web page. Key functions include:
- View and edit the live DOM tree
- Inspect and modify CSS styles
- Audit accessibility information
- Analyze network requests and performance
- Identify layout issues or style problems
- Live edit code changes right in the browser
For front-end developers, the Inspector is indispensable for debugging HTML, CSS and accessibility issues. You can instantly see how changes to markup and styles affect rendering.
The Debugger
Safari's JavaScript Debugger allows pausing code execution to step through scripts line-by-line. You can:
- Set breakpoints to isolate issues
- Inspect stack traces and variable scopes
- Profile memory usage and CPU utilization
- Emulate device throttling conditions
- Blackbox third-party scripts
The Debugger equips you to tackle even the most complex JavaScript bugs. From tracking down logic errors to profiling performance, it's an essential tool for front-end logic and optimization.
The Resources Panel
This panel displays all resources loaded by the page like scripts, stylesheets, fonts, images and media. For each resource you can:
- View request URLs, status codes and timings
- Filter by type, folder location or domain
- Check dependencies and redundancy
- Audit performance and bottlenecks
- Download resources to your machine
Knowing exactly what resources a page loads is invaluable for optimizing performance. The Resources panel helps you eliminate unnecessary requests and prioritize critical assets.
Storage Inspector
The Storage Inspector lets you view and edit browser storage like cookies, LocalStorage, SessionStorage and IndexedDB. You can:
- Add, modify or delete stored keys and values
- Export storage data as JSON
- Emulate different browser states for testing
- Clear storage entirely to test initial experience
Being able to inspect persistence mechanisms is vital for debugging issues related to state management in modern web apps.
The Audits Panel
Safari's Audits panel runs diagnostics on pages to surface optimization opportunities and standards compliance issues. Audits include:
- Performance analysis and scoring
- Accessibility checks following WCAG guidelines
- Best practices for progressive web apps
- SEO enhancements
- Modern web platform usage
Running audits before launching any website can help you catch critical problems early and compare against industry benchmarks.
Advanced Safari Developer Tools
Beyond the basics, Safari offers powerful advanced tools for seasoned developers.
Device Mode
Device Mode accurately emulates mobile screens and conditions right in desktop Safari:
- Simulate precise device dimensions and resolution
- Throttle CPU and network to mimic real devices
- Essential for building mobile-friendly, responsive sites
- Test touch events and gestures during development
With Device Mode, you can build fully optimized mobile experiences without constantly switching devices.
Advanced Debugging
Safari provides next-level JavaScript debugging capabilities:
- Set conditional breakpoints using expressions
- Group breakpoints for easy management
- Step through async code with async stack traces
- Profile memory heap allocations over time
- Blackbox scripts to hide library code
- Break on caught or uncaught exceptions
These advanced features help you tackle difficult bugs in even the most complex single-page apps and frameworks like Vue.js.
Network Throttling
Network Throttling allows simulating slow network connections, like 3G and LTE. You can:
- Rate limit bandwidth and latency
- Identify assets blocking page load
- Debug loading behavior in emerging markets
- Optimize performance for offline/low-bandwidth
- Throttle cache usage and response compression
Testing how your site performs under real-world network conditions is crucial to providing good user experiences for all.
Experimental Features
Safari lets developers try out experimental tools before they are formally released:
- Get early access to new capabilities
- Provide feedback to help shape future features
- Use at your own risk as they are still in development
- Currently includes CSS Flexbox debugging tools
Tapping into experimental features allows you to build cutting-edge experiences and directly influence the browser platform's evolution.
Debugging JavaScript Issues
Now let's explore strategies for debugging JavaScript using Safari's advanced capabilities.
Breakpoint Usage
Effective breakpoint usage is key for isolating issues:
- Set breakpoints directly within the source code
- Organize breakpoints into groups by context
- Use conditional breakpoints to pause on specific criteria
- Disable breakpoints without deleting to toggle behavior
- Manage breakpoints efficiently even in complex codebases
Mastering breakpoints gives you precise control over pausing execution to inspect logic flow and data.
Scope Inspection
Understanding scope is vital for tracking down variable issues:
- Inspect variable values in different call frames
- Detect scope pollution across closures and modules
- Ensure code executes in the intended lexical scope
- Fix bugs caused by accessing stale variable references
- Avoid global namespace pollution
With Safari's scoping tools, you can confidently debug even complex nested closures and callback contexts.
Async Debugging
Safari provides multiple approaches for debugging asynchronous code:
- Step through promise resolutions and rejections
- Inspect async operation call stacks and task queues
- Profile async code performance with CPU profiler
- Set breakpoints within async callbacks and timers
- Visually trace async code flows
Smooth async debugging helps you tackle race conditions, timing issues, and callback hell.
Error Handling
The key to debugging runtime errors is Safari's break on exception feature:
- Break on any caught or uncaught exceptions
- Inspect error call stacks to trace where issues originate
- Log values with console.log() to debug logic flow
- Validate edge cases and fix crashes
- Handle errors gracefully to improve user experience
With robust error handling, you can isolate bugs quicker and build more resilient apps.
Optimizing Page Speed
Next let's explore some common techniques for optimizing page speed using Safari developer tools.
Image Optimization
Safari provides multiple ways to optimize images:
- Audit image sizes and formats using the Resources panel
- Compress and resize images as needed
- Lazy load offscreen images to improve TTI
- Serve next-gen formats like WebP to Safari users
- Remove unnecessary decorative images
With Safari's insight into image resources, you can significantly cut page weight and load times.
Script Loading
Optimizing script loading is key for performance:
- Minimize parser-blocking JavaScript
- Load non-critical scripts asynchronously
- Dynamically create and load scripts
- Code split bundles into logical chunks
- Tree shake and minify code to reduce payload
Safari shows you exactly how scripts impact loading behavior so you can optimize delivery.
Caching Assets
Effective caching can boost repeat visit performance:
- Set optimal cache lifetimes for static assets
- Cache assets locally using service workers
- Version assets linked to app release cycles
- Avoid cache-busting query strings
- Maximize cache reuse for returning users
The Resources panel helps you dial in caching for faster loads without staleness.
Layout Thrashing
Diagnosing layout thrashing is key for smooth UX:
- Identify forced synchronous layouts
- Defer non-critical DOM updates with requestAnimationFrame()
- Avoid reading styles after writes during rendering
- Batch DOM reads/writes together
- Profile with Debugger to pinpoint problems
With Safari's performance tools, you can isolate and fix sources of jank and lag.
Wrap Up and Key Takeaways
Safari developer tools provide everything needed to build high-quality websites targeting Apple's ecosystem.
Key highlights include:
- Debugging directly on iOS devices with Web Inspector
- Stepping through JavaScript with advanced Debugger features
- Auditing pages for standards compliance
- Simulating mobile devices and networks during development
- Optimizing performance using Network Throttling
- Trying out experimental capabilities early
- Discovering new Safari dev tools on platforms like DevHunt
Learning Safari developer tools allows you to find and fix cross-browser issues faster. You can optimize sites specifically for Safari and deliver stellar experiences to millions of Apple users worldwide.
With a comprehensive understanding of Safari's robust toolset, you can confidently build, debug and enhance modern progressive web apps. Safari developer tools help web developers succeed across platforms.
Related posts
- Safari Developer Tools: The Complete Guide for Web Developers
- Discover the Top Web Developer Tools for 2023
- Unlock Safari's Powerful Developer Tools
- Dev Tools iOS Developers Need in 2023
- Tech Gift Ideas for Mom
- Hot Tech Deals at Target Right Now
How to Activate the iPhone Debug Console or Web Inspector
Use Safari's web developer tools to study problematic websites
:max_bytes(150000):strip_icc():format(webp)/ScottOrgera-f7aca23cc84a4ea9a3f9e2ebd93bd690.jpg)
- Saint Mary-of-the-Woods College
- Switching from Android
What to Know
- Activate Web Inspector on iOS: Go to Settings > Safari > Advanced and move the Web Inspector toggle switch to the On position.
- Use Web Inspector on macOS: Connect your iOS device to a Mac and choose the URL to inspect from the Develop menu.
If you run into a bug or another issue with a website on Safari mobile, use the Web Inspector tool to investigate. This article explains how to use the Safari console for iPhone to debug errors with the help of your Mac computer. Instructions apply to iPhones with iOS 14, iOS 12, or iOS 11, and well as Macs with macOS Big Sur (11.0), macOS Catalina (10.15), or macOS Mojave (10.14).
Activate Web Inspector on Your iPhone or Other iOS Device
The Web Inspector is disabled by default since most iPhone users have no use for it. However, if you're a developer or you're curious, you can activate it in a few short steps. Here's how:
Open the iPhone Settings menu.
On an iPhone with an early version of iOS, access the Debug Console through Settings > Safari > Developer > Debug Console . When Safari on the iPhone detects CSS, HTML, and JavaScript errors, details of each display in the debugger.
Scroll down and tap Safari to open the screen that contains everything related to the Safari web browser on your iPhone, iPad, or iPod touch.
Scroll to the bottom of the page and select Advanced .
Move the Web Inspector toggle switch to the On position.
Connect Your iOS Device to Safari on a Mac
To use the Web Inspector, connect your iPhone or another iOS device to a Mac that has the Safari web browser and enable the Develop menu .
With Safari open, select Safari from the menu bar and choose Preferences .
Select the Advanced tab.
Select the Show Develop menu in menu bar check box and close the settings window.
From the Safari menu bar, select Develop and choose the name of your attached iOS device, then select the URL that appears under Safari to open the debug console for that site.
After you connect your device, use your Mac to inspect the website you want to debug and have it open in the Safari mobile browser.
What Is Web Inspector?
Web developers use Web Inspector to modify, debug, and optimize websites on Macs and iOS devices. With Web Inspector open, developers can inspect the resources on a web page. The Web Inspector window contains editable HTML and notes regarding the styles and layers of the web page in a separate panel.
Before iOS 6, the iPhone Safari web browser had a built-in Debug Console that developers used to find web page defects. Recent versions of iOS use Web Inspector instead.
With Safari 9 and OS X Mavericks (10.9), Apple introduced Responsive Design Mode in Web Inspector. Developers use this built-in simulator to preview how web pages scale to different screen sizes, resolutions, and orientations.
To set up Web Inspector on your iPad, open your iPad's Settings and select Safari > Advanced , then turn Web Inspector On . Connect the iPad to a Mac computer, then open Safari on the Mac and select Safari > Preferences > Advanced , then turn on Show Develop menu in menu bar .
You cannot just connect your iPhone to a Windows PC and start using Web Inspector through Chrome like you can with a Mac. Installing package manager software can provide you a sort of workaround, but it's not recommended unless you're familiar with the package management app you intend to use.
Get the Latest Tech News Delivered Every Day
- Add More Features by Turning on Safari's Develop Menu
- How to Use Web Browser Developer Tools
- How to Activate and Use Responsive Design Mode in Safari
- How to Clear Search History on iPhone
- What Is Safari?
- How to Inspect an Element on a Mac
- 4 Ways to Play Fortnite on iPhone
- How to Disable JavaScript in Safari for iPhone
- 10 Hidden Features in macOS Sonoma
- How to Manage History and Browsing Data on iPhone
- How to View HTML Source in Safari
- How to Manage Cookies in the Safari Browser
- How to Change Your Homepage in Safari
- How to Clear Private Data, Caches, and Cookies on Mac
- How to Reset Safari to Default Settings
- How to Manage Your Browsing History in Safari
Looks like no one’s replied in a while. To start the conversation again, simply ask a new question.
How to turn off safari developer mode
EtreCheck says that Safari's developer mode is eating 60% of my CPU. how do I turn this off?
MacBook Pro, OS X El Capitan (10.11), 3 GHz core duo, 8GB RAM
Posted on Dec 8, 2015 11:18 AM
Posted on Dec 8, 2015 11:50 AM
In Safari, Preferences -> Advanced
Loading page content
Page content loaded
Dec 8, 2015 11:50 AM in response to Nicky McCatty
Dec 8, 2015 12:14 PM in response to Nicky McCatty
Hello Nicky,
As the developer of EtreCheck, I am unaware of any setting that might show that. It is best to post your entire EtreCheck report. Each individual line may not have much meaning. But taken together, they might tell a story.
Jan 4, 2016 9:14 AM in response to etresoft
So I didn't reply to your post. I had so much maintenance at the time that I lost rack of this. I will send your answer as soon as etrecheck is finished.
EtreCheck version: 2.6.6 (226)
Report generated 1/4/16, 12:13 PM
Runtime 7:40
Download EtreCheck from http://etrecheck.com
Click the [Click for support] links for help with non-Apple products.
Click the [Click for details] links for more information about that line.
Hardware Information: (What does this mean?)
MacBook Pro (15-inch, Mid 2009)
[Click for Technical Specifications]
[Click for User Guide]
MacBook Pro - model: MacBookPro5,3
1 3.06 GHz Intel Core 2 Duo CPU: 2-core
8 GB RAM Upgradeable
[Click for upgrade instructions]
BANK 0/DIMM0
4 GB DDR3 1067 MHz ok
BANK 1/DIMM0
Bluetooth: Old - Handoff/Airdrop2 not supported
Wireless: en1: 802.11 a/b/g/n
Battery: Health = Check Battery - Cycle count = 642 - SN = W0113P88WBWZA
Video Information: (What does this mean?)
NVIDIA GeForce 9400M - VRAM: 256 MB
NVIDIA GeForce 9600M GT - VRAM: 512 MB
Color LCD 1440 x 900
System Software: (What does this mean?)
OS X El Capitan 10.11.2 (15C50) - Time since boot: about 3 days
Disk Information: (What does this mean?)
APPLE HDD HTS545050A7E362 disk0 : (500.11 GB) (Rotational)
EFI (disk0s1) <not mounted> : 210 MB
hadar (disk0s2) / : 499.25 GB (216.76 GB free)
Recovery HD (disk0s3) <not mounted> [Recovery]: 650 MB
HL-DT-ST DVDRW GS23N ()
USB Information: (What does this mean?)
Apple Inc. BRCM2046 Hub
Apple Inc. Bluetooth USB Host Controller
Apple Inc. Apple Internal Keyboard / Trackpad
Apple Computer, Inc. IR Receiver
Logitech USB Receiver
Apple Card Reader
Apple Inc. Built-in iSight
Gatekeeper: (What does this mean?)
Kernel Extensions: (What does this mean?)
/Applications/TechTool Pro 7.app
[not loaded] com.micromat.driver.spdKernel (1 - SDK 10.8) [Click for support]
[not loaded] com.micromat.driver.spdKernel-10-8 (1 - SDK 10.8) [Click for support]
/Applications/Utilities/DiskWarrior.app
[not loaded] com.alsoft.Preview (4.4) [Click for support]
/System/Library/Extensions
[not loaded] com.Logitech.Unifying.HID Driver (1.3.0 - SDK 10.6) [Click for support]
[not loaded] com.NCHSoftware.driver.SoundTapVirtualAudioDevice (1.0.0d1) [Click for support]
[not loaded] com.markspace.driver.Android.RNDIS (1.2) [Click for support]
[not loaded] com.palm.ClassicNotSeizeDriver (3.2.1) [Click for support]
[not loaded] com.wacom.kext.wacomtablet (6.2.0w4) [Click for support]
~/Library/Application Support/Sparkle/Transmit/Transmit 4.1.9 Update/Transmit.app
[not loaded] com.panic.TransmitDisk.transmitdiskfs (4.0.0 - SDK 10.5) [Click for support]
System Launch Agents: (What does this mean?)
[killed] com.apple.CallHistoryPluginHelper.plist
[killed] com.apple.EscrowSecurityAlert.plist
[killed] com.apple.FolderActionsDispatcher.plist
[killed] com.apple.cdpd.plist
[killed] com.apple.followupd.plist
[killed] com.apple.gamed.plist
[killed] com.apple.icloud.fmfd.plist
[killed] com.apple.telephonyutilities.callservicesd.plist
8 processes killed due to insufficient RAM
System Launch Daemons: (What does this mean?)
[killed] com.apple.awdd.plist
[killed] com.apple.coresymbolicationd.plist
[killed] com.apple.emond.aslmanager.plist
[killed] com.apple.icloud.findmydeviced.plist
[killed] com.apple.nsurlsessiond.plist
[killed] com.apple.periodic-daily.plist
[killed] com.apple.periodic-weekly.plist
[killed] com.apple.sandboxd.plist
[killed] com.apple.wdhelper.plist
[killed] com.apple.xpc.smd.plist
10 processes killed due to insufficient RAM
Launch Agents: (What does this mean?)
[loaded] com.adobe.AAM.Updater-1.0.plist [Click for support]
[failed] com.adobe.ARMDCHelper.cc24aef4a1b90ed56a...plist [Click for support]
[loaded] com.adobe.CS5ServiceManager.plist [Click for support]
[loaded] com.google.keystone.agent.plist [Click for support]
Launch Daemons: (What does this mean?)
[loaded] com.adobe.ARMDC.Communicator.plist [Click for support]
[loaded] com.adobe.ARMDC.SMJobBlessHelper.plist [Click for support]
[loaded] com.adobe.SwitchBoard.plist [Click for support]
[loaded] com.google.keystone.daemon.plist [Click for support]
[loaded] com.malwarebytes.MBAMHelperTool.plist [Click for support]
User Launch Agents: (What does this mean?)
[failed] com.adobe.ARM.[...].plist [Click for support]
[loaded] com.apple.SafariBookmarksSyncer.plist - /Applications/Safari.app/Contents/SafariSyncClient.app/Contents/MacOS/SafariSyn cClient: Executable not found!
User Login Items: (What does this mean?)
apple-scc-20151117-123139 UNKNOWN (missing value)
CrashPlan menu bar Application (/Applications/CrashPlan.app/Contents/Helpers/CrashPlan menu bar.app)
Other Apps: (What does this mean?)
[running] J8RPQ294UB.com.skitch.SkitchHelper
[loaded] QA2G25RMZ4.com.wunderkinder.wunderlist-helper
[running] com.code42.b42menuextra.1478752
[running] com.crashplan.engine
[running] com.dashlane.DashlaneAgent
[running] com.etresoft.EtreCheck.566432
[running] com.google.Chrome.945952
[running] org.derailer.Paparazzi.1043232
Internet Plug-ins: (What does this mean?)
FlashPlayer-10.6: Version: 20.0.0.235 - SDK 10.6 [Click for support]
QuickTime Plugin: Version: 7.7.3
AdobePDFViewerNPAPI: Version: 15.009.20077 - SDK 10.8 [Click for support]
AdobePDFViewer: Version: 15.009.20077 - SDK 10.8 [Click for support]
Flash Player: Version: 20.0.0.235 - SDK 10.6 Outdated! Update
Default Browser: Version: 601 - SDK 10.11
Google Earth Web Plug-in: Version: 7.1 [Click for support]
Silverlight: Version: 5.1.41105.0 - SDK 10.6 [Click for support]
JavaAppletPlugin: Version: 15.0.1 - SDK 10.7 Check version
User internet Plug-ins: (What does this mean?)
CitrixOnlineWebDeploymentPlugin: Version: 1.0.105 [Click for support]
RealPlayer Plugin: Version: Unknown
Safari Extensions: (What does this mean?)
Pin It Button
Save to Pocket
Evernote Web Clipper
Fontface Ninja
3rd Party Preference Panes: (What does this mean?)
Growl [Click for support]
Time Machine: (What does this mean?)
Skip System Files: NO
Mobile backups: ON
Auto backup: YES
Volumes being backed up:
hadar: Disk size: 499.25 GB Disk used: 282.49 GB
Destinations:
ozer [Local]
Total size: 2.00 TB
Total number of backups: 49
Oldest backup: 11/29/15, 11:45 PM
Last backup: 1/4/16, 9:00 AM
Size of backup disk: Excellent
Backup size 2.00 TB > (Disk size 499.25 GB X 3)
Top Processes by CPU: (What does this mean?)
85% Google Chrome Helper(11)
6% com.apple.WebKit.WebContent(11)
4% WindowServer
3% Google Chrome
Top Processes by Memory: (What does this mean?)
1.66 GB com.apple.WebKit.WebContent(11)
999 MB Google Chrome Helper(11)
842 MB kernel_task
639 MB CrashPlanService
238 MB Safari
Virtual Memory Information: (What does this mean?)
51 MB Free RAM
8.20 GB Used RAM (1.33 GB Cached)
2.59 GB Swap Used
Diagnostics Information: (What does this mean?)
Jan 3, 2016, 10:09:32 PM ~/Library/Logs/DiagnosticReports/Adobe Illustrator_2016-01-03-220932_[redacted].crash
Jan 3, 2016, 10:08:30 PM ~/Library/Logs/DiagnosticReports/Adobe Photoshop CS5_2016-01-03-220830_[redacted].crash
Jan 1, 2016, 05:12:32 PM ~/Library/Logs/DiagnosticReports/Adobe Illustrator_2016-01-01-171232_[redacted].crash
Jan 1, 2016, 03:54:03 PM /Library/Logs/DiagnosticReports/Adobe Fireworks CS5_2016-01-01-155403_[redacted].hang
Jan 5, 2016 6:48 AM in response to Nicky McCatty
Try quitting Chrome. Google Chrome Helper is using 85% of your CPU. After quitting Chrome, go to Applications/Utilities/Activity Monitor/CPU and if Chrome Helper is still running, select it and hit the X at the top left to quit it.
Jan 6, 2016 3:09 PM in response to Eric Root
Thanks Eric, that definitely helped.
Jan 6, 2016 5:06 PM in response to Nicky McCatty
Nicky McCatty wrote: Thanks Eric, that definitely helped.
That's actually why I never recommend anyone use Chrome. It takes up too much RAM and slows your system down to a crawl. If you don't want to use Safari for whatever reason, use Firefox. It's nowhere near as memory intensive.
Jan 6, 2016 7:37 PM in response to pinkstones
II use Safari most of the time; unfortunately, the signal I've been getting is lousy, and Sprint's little booster doesn't do the trick, so I've been using Hangouts, which only runs in Chrome.
- a. Send us an email
- b. Anonymous form
- Buyer's Guide
- Upcoming Products
- Tips / Contact Us
- Podcast Instagram Facebook Twitter Mastodon YouTube Notifications RSS Newsletter
Apple Releases Safari Technology Preview 192 With Bug Fixes and Performance Improvements
Apple today released a new update for Safari Technology Preview , the experimental browser Apple first introduced in March 2016. Apple designed the Safari Technology Preview to test features that may be introduced into future release versions of Safari.

The current Safari Technology Preview release is compatible with machines running macOS Ventura and macOS Sonoma , the latest version of macOS that Apple released in September 2023.
The Safari Technology Preview update is available through the Software Update mechanism in System Preferences or System Settings to anyone who has downloaded the browser . Full release notes for the update are available on the Safari Technology Preview website .
Apple's aim with Safari Technology Preview is to gather feedback from developers and users on its browser development process. Safari Technology Preview can run side-by-side with the existing Safari browser and while designed for developers, it does not require a developer account to download.
Get weekly top MacRumors stories in your inbox.
Top Rated Comments
"and Performance Improvements" Sooooo...at long last, it's the most snappiest Safari we've ever created. You're going to love it
Popular Stories

When to Expect a New Apple TV to Launch

When to Expect the Next iPad Mini and Low-End iPad Models to Launch

Alleged iPhone 16 Battery Details Show Smaller Capacity for One Model

Best Buy Introduces Record Low Prices Across Every 10th Gen iPad

Microsoft Says Windows Laptops With Snapdragon X Elite Will Be Faster Than M3 MacBook Air

Apple Event for New iPads Still Considered 'Unlikely' Following Delays

Google Launches Android Find My Device Network
Next article.

Our comprehensive guide highlighting every major new addition in iOS 17, plus how-tos that walk you through using the new features.

App Store changes for the EU, new emoji, Podcasts transcripts, and more.

Get the most out your iPhone 15 with our complete guide to all the new features.
A deep dive into new features in macOS Sonoma, big and small.

Revamped models with OLED displays, M3 chip, and redesigned Magic Keyboard accessory.

Updated 10.9-inch model and new 12.9-inch model, M2 chip expected.

Apple's annual Worldwide Developers Conference will kick off with a keynote on June 10.

Expected to see new AI-focused features and more. Preview coming at WWDC in June with public release in September.
Other Stories

11 hours ago by Tim Hardwick

12 hours ago by Tim Hardwick

12 hours ago by MacRumors Staff

2 days ago by Tim Hardwick

1 week ago by MacRumors Staff
Apple touts major 60% leap in Safari and WebKit performance
Apple’s WebKit team has published a new blog post this week detailing how they’ve made significant upgrades to Safari’s performance over the last several months. The improvements come following the debut of Speedometer 3.0 in March, described as a “major step forward in making the web faster for all.”
Back in March, Apple, Google, and Mozilla teamed up to launch the new Speedometer 3 browser benchmark. The goal of Speedometer 3 is to “create a shared understanding of web performance so that improvements can be made to enhance the user experience.”
The results provided by Speedometer 3 offer more details on how the test “captures and calculates scores, show more detailed results and introduce an even wider variety of workloads.” Apple says:
The introduction of Speedometer 3.0 is a major step forward in making the web faster for all, and allowing Web developers to make websites and web apps that were not previously possible.
Apple’s WebKit team says that it has successfully improved Safari’s Speedometer 3.0 score by ~60% between the release of Safari 17.0 in September and Safari 17.4’s release in March. These improvements, Apple says, mean that developers can build websites and web apps that are faster than ever before:
With all these optimizations and dozens more, we were able to improve the overall Speedometer 3.0 score by ~60% between Safari 17.0 and Safari 17.4. Even though individual progressions were often less than 1%, over time, they all stacked up together to make a big difference. Because some of these optimizations also benefited Speedometer 2.1, Safari 17.4 is also ~13% faster than Safari 17.0 on Speedometer 2.1. We’re thrilled to deliver these performance improvements to our users allowing web developers to build websites and web apps that are more responsive and snappier than ever.
The full blog post has a ton of technical details on the work that has been done to optimize WebKit and Safari for Speedometer 3.0.
Follow Chance : Threads , Twitter , Instagram , and Mastodon .
FTC: We use income earning auto affiliate links. More.
Check out 9to5Mac on YouTube for more Apple news:

Chance is an editor for the entire 9to5 network and covers the latest Apple news for 9to5Mac.
Tips, questions, typos to [email protected]

IMAGES
VIDEO
COMMENTS
Open Safari on your Mac and click the "Safari" button in the menu bar. Next, select "Preferences." Alternatively, you can use the keyboard shortcut Command+, (comma). This will also open up Safari preferences. Go to the "Advanced" tab. Check the box for "Show Develop Menu in Menu Bar." Now the Develop menu will appear between Bookmarks and ...
Disable site-specific hacks. On rare occasions, when a particular website does not work correctly in Safari, modifications are made in browser code to get that site to work. This setting disables such modifications to make it possible for the site's developers to debug their problem. If there are no site-specific hacks, this setting has no ...
If you're a web developer, the Safari Develop menu provides tools you can use to make sure your website works well with all standards-based web browsers. If you don't see the Develop menu in the menu bar, choose Safari > Preferences, click Advanced, then select "Show Develop menu in menu bar.". See also Safari for Developers.
Overview. Safari includes features and tools to help you inspect, debug, and test web content in Safari, in other apps, and on other devices including iPhone, iPad, Apple Vision Pro, as well as Apple TV for inspecting JavaScript and TVML. Features like Web Inspector in Safari on macOS let you inspect and experiment with the layout of your ...
Overview. The Develop menu is home to the tools available to design and develop web content in Safari, as well as web content used by other applications on your Mac and other devices. The Develop menu also provides quick access to Changing Developer settings in Safari on macOS and Changing Feature Flag settings in Safari on macOS.. Note. If you haven't already enabled features for web ...
Web developers rely on Safari Developer Mode; it is a great tool with multiple features and functions vital for effective web development. For web developers, the Safari Developer Mode equipped with the Web Inspector forms an amazing partner that possesses a toolbox for creating, debugging, and optimizing websites.
Launch Safari from the Dock or the Mac Application folder. Open Safari's preferences by clicking Safari in the menu bar and selecting Preferences in the drop-down menu. Click the Advanced tab in the preferences screen. Select Show Develop menu in menu bar . Should you ever want to disable the Developer menu, remove the check mark in the Safari ...
How To Show in Develop Menu in Safari on Mac. Step #1. Open Safari on your Mac. Step #2. Now click Safari on the Menu bar and then click on Preferences…. Step #3. In Safari Preferences, click on Advanced tab. Step #4. All you need to do now is to check the box beside "Show Develop menu in menu bar" option.
To debug your website using the Responsive Design mode on Safari, follow the steps mentioned below: Enable the Developer Menu. To do that, launch the Safari Browser on your Mac computer. Go to Preferences > Advanced and check the Show Develop menu in the menu bar. Navigate to the website you want to debug.
In this video, you will learn some of the main features of the Safari dev console including - * How to enable Debug Mode* Shortcut / Pin Developer Console in...
To use it you must enable it in Safari Preferences. Click on the Advanced tab and check the box beside the phrase "Show Develop menu in menu bar" at the bottom of the pane. You will now see a ...
Enable Developer Mode. In Safari, the console is a part of the developer tools, which are not visible by default. To enable them: Step 1: Open Safari Settings. Go to Safari > Settings or press Command + , to open the Preferences panel. Step 2: Unlock the Advanced Tab. Navigate to the 'Advanced' tab.
To access the Responsive Design Mode, enable the Safari Develop menu. Follow the steps below to enable the Develop menu: Launch Safari browser. Click on Safari -> Settings -> Advanced. Select the checkbox -> Show Develop menu in menu bar. Once the Develop menu is enabled, it'll show up in the menu bar as shown in the image below: Note ...
Its integrated developer tools provide everything web developers need to build, debug and optimize websites for Apple's ecosystem. In this comprehensive tutorial, we'll cover key capabilities of Safari's dev tools including: The Web Inspector for inspecting page structure and CSS. The Debugger for stepping through JavaScript code.
On the ipad go to Settings > Safari > Advanced and activate the Web Inspector.. Connect your ipad with your computer. On your computer open Safari, enable the developer tools in the settings. check the above menu for the tab Developer and find your iPad there.. Full control via console from your desktop machine over the iOS Safari and you're done!. PS: This works exact the same way with the ...
Activate Web Inspector on iOS: Go to Settings > Safari > Advanced and move the Web Inspector toggle switch to the On position. Use Web Inspector on macOS: Connect your iOS device to a Mac and choose the URL to inspect from the Develop menu. If you run into a bug or another issue with a website on Safari mobile, use the Web Inspector tool to ...
Safari on macOS has several tools for web developers, including the Develop menu, Web Inspector, and WebDriver, which are turned off by default. To enable these tools: From the menu bar, choose Safari. Select Settings… (⌘,). Go to the Advanced pane. Check the Show features for web developers checkbox. Enable features and settings for web ...
To enable the Safari development mode, follow the steps listed below: Launch the Safari browser. Click Safari -> Preferences -> Advanced. Select the checkbox -> Show Develop menu in the menu bar. Once the Develop menu is enabled, 'Enter Responsive Design Mode' will show up in the menu bar, as shown in the image below:
Safari for developers. Safari is the best way to experience the internet on iPhone, iPad, and Mac. Thanks to blazing-fast performance and industry-leading energy efficiency, millions of users enjoy exploring the web with Safari. ... Responsive Design Mode makes it easy to see how your websites will render in this view — just tap the iPad ...
In Safari 12, select the row in the network tab. The response will be displayed in the main area. Above it will be a few tabs. Select the Headers tab and take a look in the request part of the displayed data for some request info. For details on the request data, take a look under "Request Data".
Posted on Dec 8, 2015 11:50 AM. In Safari, Preferences -> Advanced. In Safari, Preferences -> Advanced. Hello Nicky, As the developer of EtreCheck, I am unaware of any setting that might show that. It is best to post your entire EtreCheck report. Each individual line may not have much meaning.
Web development tools. Apple has brought its expertise in development tools to the web. Safari includes Web Inspector, a powerful tool that makes it easy to modify, debug, and optimize websites for peak performance and compatibility on both platforms. And with Responsive Design Mode, you can preview your web pages in various screen sizes ...
Apple's aim with Safari Technology Preview is to gather feedback from developers and users on its browser development process. Safari Technology Preview can run side-by-side with the ...
Apple's WebKit team says that it has successfully improved Safari's Speedometer 3.0 score by ~60% between the release of Safari 17.0 in September and Safari 17.4's release in March. These ...
To toggle Developer mode, use the Developer Mode switch. Tap the switch to enable Developer Mode. After you do so, Settings presents an alert to warn you that Developer Mode reduces the security of your device. To continue enabling Developer Mode, tap the alert's Restart button. After the device restarts and you unlock it, the device shows an ...