Click through the PLOS taxonomy to find articles in your field.
For more information about PLOS Subject Areas, click here .
Loading metrics
Open Access
Peer-reviewed
Research Article

What Are the Health Benefits of Active Travel? A Systematic Review of Trials and Cohort Studies
Affiliation Faculty of Public Health and Policy, London School of Hygiene and Tropical Medicine, London, United Kingdom
* E-mail: [email protected]
Affiliation General and Adolescent Paediatrics Unit, UCL Institute of Child Health, London, United Kingdom
- Lucinda E. Saunders,
- Judith M. Green,
- Mark P. Petticrew,
- Rebecca Steinbach,
- Helen Roberts
- Published: August 15, 2013
- https://doi.org/10.1371/journal.pone.0069912
- Reader Comments
Increasing active travel (primarily walking and cycling) has been widely advocated for reducing obesity levels and achieving other population health benefits. However, the strength of evidence underpinning this strategy is unclear. This study aimed to assess the evidence that active travel has significant health benefits.
The study design was a systematic review of (i) non-randomised and randomised controlled trials, and (ii) prospective observational studies examining either (a) the effects of interventions to promote active travel or (b) the association between active travel and health outcomes. Reports of studies were identified by searching 11 electronic databases, websites, reference lists and papers identified by experts in the field. Prospective observational and intervention studies measuring any health outcome of active travel in the general population were included. Studies of patient groups were excluded.
Twenty-four studies from 12 countries were included, of which six were studies conducted with children. Five studies evaluated active travel interventions. Nineteen were prospective cohort studies which did not evaluate the impact of a specific intervention. No studies were identified with obesity as an outcome in adults; one of five prospective cohort studies in children found an association between obesity and active travel. Small positive effects on other health outcomes were found in five intervention studies, but these were all at risk of selection bias. Modest benefits for other health outcomes were identified in five prospective studies. There is suggestive evidence that active travel may have a positive effect on diabetes prevention, which may be an important area for future research.
Conclusions
Active travel may have positive effects on health outcomes, but there is little robust evidence to date of the effectiveness of active transport interventions for reducing obesity. Future evaluations of such interventions should include an assessment of their impacts on obesity and other health outcomes.
Citation: Saunders LE, Green JM, Petticrew MP, Steinbach R, Roberts H (2013) What Are the Health Benefits of Active Travel? A Systematic Review of Trials and Cohort Studies. PLoS ONE 8(8): e69912. https://doi.org/10.1371/journal.pone.0069912
Editor: Jonatan R. Ruiz, University of Granada, Spain
Received: January 31, 2013; Accepted: June 13, 2013; Published: August 15, 2013
Copyright: © 2013 Saunders et al. This is an open-access article distributed under the terms of the Creative Commons Attribution License, which permits unrestricted use, distribution, and reproduction in any medium, provided the original author and source are credited.
Funding: This project was funded by the National Institute for Health Research Public Health Research programme (project number 09/3001/13). The views and opinions expressed herein are those of the authors and do not necessarily reflect those of the Department of Health. The funders had no role in the design, conduct or reporting of project findings.
Competing interests: The authors have declared that no competing interests exist.
The link between physical activity and health has long been known, with the scientific link established in Jerry Morris' seminal study of London bus drivers in the 1950s [1] . There is also good ecological evidence that obesity rates are increasing in countries and settings in which ‘active travel’ (primarily walking and cycling for the purpose of functional rather than leisure travel) is declining [2] , [3] . Given that transport is normally a necessity of everyday life, whereas leisure exercise such as going to a gym may be an additional burden, and is difficult to sustain long term, [4] , [5] encouraging ‘active travel’ may be a feasible approach to increasing levels of physical activity [6] . It is therefore plausible to assume that interventions aimed at increasing the amount of active travel within a population may have a positive impact on health. This has been the underlying rationale for recent public health interest in transport interventions aiming to address the obesity epidemic and a range of other health and social problems [7] ; for example, “For most people, the easiest and most acceptable forms of physical activity are those that can be incorporated into everyday life. Examples include walking or cycling instead of travelling by car, bus or train” [8] . Active travel is seen by policy makers and practitioners as not only an important part of the solution to obesity, but also for achieving a range of other health and social goals, including reducing traffic congestion and carbon emissions [9] .
It has been recommended that the public health community should advocate effective policies that reduce car use and increase active travel [10] . One recent overview concluded that active travel policies have the potential to generate large population health benefits through increasing population physical activity levels, and smaller health benefits through reductions in exposures to air pollution in the general population [6] . However, while a systematic review [11] has found that non-vigorous physical activity reduces all-cause mortality, the two studies which looked at active commuting alone [12] , [13] found no evidence of a positive effect. There are a number of reasons why active travel may not contribute to overall physical activity levels. Some studies of young children have found no differences in overall physical activity levels for active and non-active commuters [14] , [15] , [16] , perhaps because the distance walked to school may simply be too short to make a significant contribution. For both children and adults, it is unclear how far individuals may offset the extra effort of cycling or walking with additional food intake, or by reducing physical activity in other areas of everyday life. Additionally, there is evidence that the health benefits of exercise are not shared equally across populations, with the cultural and psychological meanings of activities such as walking or cycling potentially influencing their physiological effects [17] , [18] .
A reliable overview of the strength of the scientific evidence is therefore needed because the causal pathways between active travel and health outcomes such as obesity are likely to be complex, and promoting active travel may have unintended adverse consequences [19] , for example by reducing leisure activity.
Existing studies show a mixed picture on the relationship between active travel and health outcomes including obesity [20] . Recent systematic reviews have focussed almost exclusively on cross-sectional studies [20] , [22] , [23] , or one narrow health outcome [24] or on combined leisure and transport activity [25] . Obesity is a particular focus because the rise in the prevalence of obesity over the past 30–40 years has occurred in tandem with the decline of active travel, and overweight and obesity are now the fifth leading risk for death globally as well as being responsible for significant proportions of the disease burden of diabetes (44%), ischaemic heart disease (23%) and some cancers (7–41%) [21] .
Given the widespread promotion of active travel for reducing obesity in particular, and improving the public health in general, it is perhaps surprising that is, to date, no clear evidence on its effectiveness. To address this gap, a systematic review of evidence from empirical studies was carried out with the objective of assessing the health effects of active travel specifically (rather than of physical activity in general, where the evidence is already well-established). This review was undertaken to identify and synthesise the relevant empirical evidence from intervention studies and cohort studies in which health outcomes of active travel have been purposively or opportunistically measured to assess the impact of active travel on obesity and other health outcomes.
Eleven databases were searched for prospective and intervention studies of any design (Cochrane Library, CINAHL Plus, Embase, Global Health, Google Scholar, IBSS, Medline, PsychInfo, Social Policy and Practice, TRIS/TRID, Web of science – full details in Table 1 ). The review protocol is available on request from the authors. The search strategy adapted the search terms developed by Hoskings et al. [26] (2010 Cochrane Review) and Bunn et al. [27] (2003) to create a master search strategy for Medline (see Appendix S3 ) which was then adapted as needed to fit each database (The exact search strategy used in each database is available from the corresponding author). No time, topic or language exclusions or limits were applied. Hand-searching of relevant studies was also conducted, and bibliographies of identified papers were checked along with those of papers already known to the researchers. The PRISMA flow chart, PRISMA checklist and search strategy are included in Appendices S1, S2, and S3 respectively.
- PPT PowerPoint slide
- PNG larger image
- TIFF original image
https://doi.org/10.1371/journal.pone.0069912.t001
Two reviewers independently identified potentially relevant prospective studies. If it was not clear from the title and abstract whether the article was relevant to active travel, then the paper was reviewed in detail. Non-English language studies were eligible for inclusion, though no relevant studies were identified. One reviewer then screened the articles using the following inclusion criteria:
- Prospective study examining relationship between active travel and health outcomes; or study evaluating the effect of an active travel intervention; and
- Active travel (walking or cycling for transport rather than work or leisure) measured in a healthy population (e.g. using self report measures, or use of pedometers); and
- Health outcome included.
Retrospective and single cross-sectional studies (e.g. one-off surveys) were excluded.
One reviewer extracted data including information on methods, outcomes (as adjusted relative risks, or hazard ratios; if these were not available or calculable, other effect measures were extracted – e.g. mean changes), populations and setting for each study. The quality assessment was conducted using a standardized evaluation framework, the ‘Evaluation of Public Health Practice Projects Quality Assessment Tool’ (EPHPP) al. [28] [29] . Two reviewers independently reviewed each study and discussed any differences to produce consensus scores for each study against each quality criterion (see Table 4 ).
Twenty-four studies reported in thirty-one papers were included (see Tables 2 and 3 ). Five were prospective cohort studies with obesity-related outcomes, all in children; fifteen were prospective cohort studies with other health outcomes; and five were intervention studies with other health outcomes (details of excluded studies available on request from the authors). For the prospective cohort studies the results are presented adjusted for covariates. There was variation in what adjustments were made by different studies but the adjustments did not have large impacts on effect size. Details of the methodological assessment of each paper are included in Table 4 .
https://doi.org/10.1371/journal.pone.0069912.t002
https://doi.org/10.1371/journal.pone.0069912.t003
https://doi.org/10.1371/journal.pone.0069912.t004
1. Studies in adults
Eighteen studies in adults were identified; five intervention studies and thirteen prospective cohort studies.
1.1 Intervention studies.
The intervention studies included adults in north-west Europe and measured multiple health outcomes including fitness, blood pressure, cholesterol, oxygen uptake, and body weight [30] , [31] , [32] , [33] , [34] , [35] , [36] ; none measured obesity directly. Three studies found improvements in fitness measures in the intervention group compared with the control group [30] , [33] , [35] , [36] , one found increased physical activity levels [31] , [32] , [37] but one did not [35] , [36] , two found no significant change in body weight [31] , [32] , [35] , [36] and one found significantly higher scores for 3 of the 8 domains of the SF-36 in the intervention group [34] . All these studies were at risk of selection bias and none reported baseline differences between intervention and control groups for potential confounders [30] , [31] , [32] , [33] , [34] , [35] , [36] , [37] . However, all five studies were rated moderately overall. All but one [30] were controlled with appropriate statistical analyses. All but one [34] had low levels of drop-out and ensured that the intervention was consistently applied.
1.2. Prospective Cohort Studies.
The 13 prospective cohort studies of adults (described below) [12] , [13] , [38] , [39] , [40] , [41] , [42] , [43] , [44] , [45] , [46] , [47] , [48] , [49] , [50] , [51] covered a range of health outcomes. Eight were conducted in Scandinavia [12] , [38] , [39] , [40] , [42] , [43] , [44] , [45] , [46] , [47] . This may reflect the longer history of higher population levels of active travel, as a result of which questions on active travel have been included in population surveys over recent decades. Overall, these studies reported conflicting findings when measuring similar mortality and cardiovascular outcomes, with the exception of diabetes where the 2 studies both found statistically significant positive results for active travellers compared with non-active travellers and hint at a dose-response relationship [43] [52] .
Five studies investigated all cause mortality. One study in Denmark [38] found a significantly lower all-cause risk of mortality in cycle-commuters compared with non-cyclists - this was not found in a second such study in Finland [12] . Batty et al. (2001) [13] also found no statistically significant differences for 12 mortality endpoints between men in London, UK who actively travelled more or less than 20 minutes on their journey to work. Matthews et al. (2007) [48] studied women in China and found no significant relationship between walking and cycling for transport and all cause mortality [48] . Besson et al (2008) [53] studied men and women in Norfolk, UK and found a non-significant reduced risk of all cause mortality in those who travelled actively (measured as more than 8 metabolic equivalent task values (MET.h.wk −1 )). None of these studies were rated consistently strong or moderate across all quality criteria. However they did all measure different levels of active travel among participants, which was a strength.
Five studies reported on cardiovascular outcomes. Besson et al.(2008) [53] found no significant reduction in cardiovascular mortality risk among active travellers whereas Barengo (2004) [12] in Finland found it to be significantly lower (adjusted hazard ratio 0.78 [CI: 0.62–0.97]) only among women actively travelling 15–29 minutes each way to work compared with those travelling less than 15 minutes each way but not in those travelling more than 30 minutes each way, and not in men. Hu et al (2005, 2007, 2007) [42] , [44] , [45] , also measured Coronary Heart Disease and found a significant relationship in women who travelled 30+ minutes per day (0.80 [CI:0.69–0.92]) compared with those who did not travel actively at all. Like Barengo (2004) [12] , they found no relationship between active travel and Coronary Heart Disease (CHD) in men. Barengo (2005) [39] found no difference in hypertension risk between those travelling more or less than 15 minutes each way to work. Hayashi et al. (1999) [41] found a statistically significant reduced risk of hypertension in those men in Osaka, Japan who walked 21 minutes or more to work compared with men who walked less than 10 minutes (adjusted relative risk 0.70 [CI: 0.59–0.95]). However, it was not clear from either of these papers how frequently the active travellers walked to work. Wagner et al. (2001, 2002, 2003) [49] , [50] , [51] found a statistically non-significant increase in risk of CHD events in men walking and cycling to work, although the amount of exercise taken while actively commuting was not recorded.
Four studies examined health outcomes other than all cause mortality or cardiovascular disease. Two studies found significant benefits of active travel for reducing diabetes risk. A study in Japan by Sato et al found a 27% reduced odds of type 2 diabetes among men who walked more than 21 minutes to work compared with those who walked less than 10 minutes (CI:0.58–0.92) [52] . A study in Finland [43] found the relative risk for Type 2 diabetes to be 34% lower among active travellers travelling 30 minutes or more per day compared with those not travelling actively (CI: 0.45–0.92). Luoto et al. 2000 [47] reported a non-significant reduction in relative breast cancer risk at 15 years follow-up of 0.87 (CI: 0.62–1.24) in women who actively travelled more than 30 minutes each day. Moayyeri et al. (2010) found no significant association between active travel and bone strength and fracture risk, but the numbers of study participants who travelled actively were extremely small [54] .
2. Studies in children
No intervention studies in children were identified. Four prospective cohort studies were identified with obesity outcomes and two with other health outcomes.
2.1 Obesity.
One prospective cohort study measured the BMI of children aged 13 and again two years later in the Netherlands and Norway [55] . This study found that those children who continued to cycle to school throughout the study period were less likely (OR 0.44, 95% confidence interval 0.21,0.88) to be overweight than those who did not cycle to school, those who took up cycling and those who stopped cycling to school. Also those who stopped cycling to school during the study were more likely to be overweight than the other groups combined (OR 3.19, 95% confidence interval 1.41, 7.24). However the authors acknowledged that there were some limitations to this study including uncontrolled confounding variables and a relatively high dropout of 56% of participants between baseline and follow-up measurements. A study in Denmark and Sweden with six year follow-up of children from aged nine found no significant association between the obesity measures (BMI, skin-folds and waist circumference) and travel mode [56] [29] . Three other prospective cohort studies with obesity outcomes were all conducted in North America and included children aged ten years or younger at baseline who were followed up for between six months and two years [57] , [58] , [59] . BMI measurements were taken in all three studies and skinfold measurements were taken in two of the studies. There was no significant association between active travel and the obesity outcome measures in any of the studies. All three studies were rated low on the quality assessment measure as no data on baseline differences between groups were presented.
2.2 Other health outcomes.
Two studies examined health outcomes other than obesity. One study conducted in Denmark and Sweden found that children who cycled to school in Denmark had significantly better cardio-respiratory fitness [40] and cardiovascular risk markers than those who did not [56] . This study took a range of measures of school children aged 9 and repeated the measurements after six years. In Sweden, children who cycled to school increased their fitness 13% more than those who used passive modes and 20% more than those who walked during the six year period. Children who took up cycling during the follow up period increased their fitness by 14% compared with those who did no t [29] . However, no significant association between travel mode to school and cardiovascular risk factors was found in the Swedish arm of the study. Interestingly, the Danish arm of the study found that walkers had the same fitness levels as those who travelled by ‘passive’ modes [56] . While the study scored moderately well for selection bias (76% participation in Denmark), drop out from this study was 60% in Sweden and 43% in Denmark. This study, as was the case for many of the prospective cohort studies, may have been at risk of contamination or co-intervention as monitoring during the follow-up period was not reported. Lofgren et al. (2010) [46] also studied children actively travelling to school in Malmö, Sweden and measured a range of bone health indicators but found no significant relationship. This study scored relatively well in the quality assessment, with good controlling of confounders and high participation levels, although as with all the prospective cohort studies scored weak on study design.
This is the first review to bring together all prospective observational and intervention studies to give an overview of the evidence on health effects of active travel in general. Previous systematic reviews of health outcomes of active travel have included primarily cross-sectional studies from which reliable inferences about causality cannot easily be drawn, or have relied on indirect evidence on the effects of physical activity on health, as opposed to the effects of active travel. Although we found no prospective studies of active travel with obesity as a primary outcome in adults, and no significant associations between obesity and active travel in studies which included children, for other health outcomes small positive health effects were found in groups who actively travelled longer distances including reductions in risk of all cause mortality [38] , hypertension [41] , and in particular Type 2 diabetes [43] , [52] .
One challenge to synthesising and using this evidence is that “active travel” is not defined consistently across studies, and the definition is dependent on what is considered normal in a particular setting. For example Luoto (2000) [47] , and Barengo (2004, 2005) [12] , [39] considered active travel to be more than 30 minutes per day and inactive travel to be less than 30 minutes per day. Batty (2001) [13] , Sato (2007) [52] and Hayashi (1999) [41] however considered active travel to be more than 20 minutes per day. Differences in health outcomes between people who actively travel 29 minutes per day and those who travel 31 minutes per day are unlikely, so differences between active and sedentary populations may be masked by the methods by which active travel is defined and reported. Meanwhile Besson (2008) [53] and Moayyeri (2010) [54] considered active travel to be more than 8 metabolic equivalent task (MET) hours per week while Matthews (2007) [48] considered it to be more than 3.5 metabolic equivalent task hours per day which may reflect differences in norms between UK and China in terms of active travel.
In light of this, users of the findings of this and similar reviews need to consider the extent to which we can generalise between studies conducted in different countries or settings. In particular, the amount of exertion required to travel actively may be greater in some settings than others for the same journey time, due to differences in congestion, terrain and climate. In countries where current levels of physical activity are low (such as the UK, where only 39% of men and 29% of women achieve 30 minutes of moderate intensity physical activity of any type five times a week [60] [61] ) adding 30 minutes of active travel per day might well produce much larger changes in health at a population level than were measured in non-UK studies. The prospective cohort studies also tended to focus on travel to work or school rather than active travel for general transportation, which again may limit generalisability.
The study by Cooper et al. (2008) [40] of school children in Odense, Denmark found that 65% of boys and girls walked or cycled to school, a much higher proportion than is currently found in the UK. However, journey times were less than 15 minutes for the majority of active travellers so the health effects of active travel for such short periods are difficult to measure in isolation. This highlights one of the difficulties of assuming active travel to school in young people to be a major source of physical activity, as it is common for children only to walk or cycle to school when the journey time is relatively short. In adults as little as 10 minutes of physical activity are acceptable to contribute to their weekly physical activity target of minimum 150 minutes. However children aged five – 18 are expected to be physically active for a minimum of 420 minutes per week [8] so a short active commute to school will not make a significant contribution to their overall physical activity requirements. The study by Lofgren et al. [46] included a study population with fairly high levels of physical activity overall and half the participants were active travellers, which makes it difficult to attribute health outcomes to active travel alone, as active travel may not contribute significantly to participants overall physical activity levels.
De Geus et al. (2007) [30] highlighted one of the difficulties of measuring active travel in intervention studies as they found that study participants cycled 13% faster when their fitness was being measured compared to their usual speed on their daily cycle commute. The process of measuring active travel can therefore result in an over-estimate of the health benefits conferred by active travel. It is also not clear whether levels of active travel impact on levels of other types of physical activity such as sport and leisure. This relationship has been explored by, among others, Dombois et al who found no relationship between levels of sports activity and mode of travel in adults in the Swiss Alps [62] , and also by Santos et al who found a more complex relationship between different types of activity in children in Portugal [63] . Thus issues including type of terrain, problems of definition, study design and the difficulty of disentangling the effects of active travel from more general physical activity make synthesis difficult.
There is a particular challenge in measuring health outcomes in children because some health outcomes relating to physical activity can take many years to develop. For example an intervention study by Sirard et al. involving children in the USA measured moderate-to-vigorous physical activity (MVPA) in a randomised controlled trial with 12 participants and a two week duration [37] . However, it could not be included in this review because it did not measure a health outcome.
This review also highlights the difficulty in measuring health outcomes of active travel in the general population. In prospective cohort studies if the follow-up period is short then it may not be possible to measure health effects that take many years to appear. Conversely in those studies which do have long follow-up periods of many years there is the risk that active travel has not been consistently adhered to throughout the follow up period.
The likelihood of health outcomes will depend on the context within which individuals are travelling – length of journey, frequency of travel, nature of the terrain, risk of injury, levels of air pollution and so on as well as other aspects of the lifestyles of the participants. For example travelling actively may mean that the individual is more or less likely to be physically active at other times, or they may modify their diet. It may mean that they are more or less likely to strengthen social networks. It is also important to note that active travel not only potentially benefits health by way of physical activity but may also off-set air pollution from motorised vehicles and contribute to social and environmental goals such as improving social cohesion and reducing CO 2 emissions. These combined benefits are a potent argument for promoting active travel, and emphasise the importance of models which incorporate both health and non-health benefits [64] , [65] such as carbon dioxide emissions.
Finally, designing searches which are both sensitive and specific is a challenge for public health systematic reviews. It is interesting to note that over 70% of the studies we identified were initially found through hand-searching, although some subsequently appeared in the database searches, which highlights the importance of a broad search not confined to electronic sources. While it is possible that studies may have been missed, our comprehensive search for studies makes it unlikely that a significant body of work has been excluded.
While the studies identified in this review do not enable us to draw strong conclusions about the health effects of active travel, this systematic review of intervention and prospective studies found consistent support for the positive effects on health of active travel over longer periods and perhaps distances, and it is of interest that there is some evidence that active travel may reduce risk of diabetes. This may be an important area for future research.
These cautious conclusions on the health impact of active travel do not, of course, mean that now is the time to confine active travel to the walk from the front door to the car door. The evidence on the effect of physical activity is sufficiently strong to suggest that the part played by active travel is well worth maintaining. Other aspects of active travel, including a reduction in pollution, and in carbon footprint are clear potential co-benefits and likely to become even more so.
Supporting Information
Appendix s1..
PRISMA flowchart.
https://doi.org/10.1371/journal.pone.0069912.s001
Appendix S2.
PRISMA checklist.
https://doi.org/10.1371/journal.pone.0069912.s002
Appendix S3.
Search strategy.
https://doi.org/10.1371/journal.pone.0069912.s003
Acknowledgments
We thank the other members of the project team (Phil Edwards, Paul Wilkinson, Alasdair Jones, Anna Goodman, John Nellthorpe and Charlotte Kelly) for their advice.
Author Contributions
Conceived and designed the experiments: LS JG MP RS HR. Performed the experiments: LS JG MP RS HR. Analyzed the data: LS JG MP RS HR. Contributed reagents/materials/analysis tools: LS JG MP RS HR. Wrote the paper: LS JG MP RS HR.
- View Article
- Google Scholar
- 7. Wanless D, Treasury H (2004) Securing good health for the whole population: final report. London: HM Treasury. 1–222 p.
- 8. Department of Health (2011) Start active, stay active: A report on physical activity from the four home countries' Chief Medical Officers. Department of Health, Physical Activity, Health Improvement and Protection.
- 21. World Health Organization (2011) Obesity and overweight.
- 28. Effective Public Health Practice Project (2009) Quality Assessment Tool for Quantitative Studies.
- 60. Health Survey for England (2009) Health Survey for England 2008. The Health and Social Care Information Centre.
Health benefits of active travel: preventable early deaths
19 April 2021
- Active travel
- Share on Twitter
- Share on LinkedIn
- Share on Facebook
- Share on WhatsApp
- Share by email
- Link Copy link

- If walking and cycling rates in all regions in England increase to the same level as the regions with the highest average daily miles walked and cycled per person, around 1,190 early deaths could be prevented each year.
This chart shows the estimated number of preventable early deaths due to increased physical activity, if walking and cycling rates in all regions met the highest existing rates, for different age groups in each region of England. The estimates are derived from the World Health Organization’s health economic assessment tool (HEAT) , which calculates the reduction in mortality as a result of physical activity from regular walking and cycling.
Increasing physical activity and minimising the time spent sitting down helps to maintain a healthy weight and reduces the risk of cardiovascular disease, type 2 diabetes, cancer and depression . The UK Chief Medical Officers recommend that adults should do at least 150 minutes of moderate activity, or 75 minutes of vigorous activity, each week.
The number of preventable early deaths is the difference between the current level of walking and cycling and a hypothetical scenario in which walking and cycling rates for different age groups in all regions increase to the same level as the regions where each age group has the highest average daily miles walked and cycled per person.
- In England, the average number of early deaths prevented is 1,189 per year, assuming that the hypothetical scenario is achieved in 1 year and the whole assessment period is 10 years.
- The number of early preventable deaths per 100,000 population per year is highest in North East England (3.6 deaths per 100,000 people) and the West Midlands (3.3 deaths per 100,000 people).
Promoting active travel and investing in measures to improve infrastructure for walking and cycling can deliver significant health benefits.
- The World Health Organization’s (WHO) health economic assessment tool (HEAT) tool uses data from published meta-analysis on the relative risk of death from any cause among people who walk or cycle regularly, compared with those who do not. The average relative risk estimates derived from the studies are then applied to the level of walking and cycling specified by users.
- The calculations are performed separately for different age groups: 20 – 49 years and 50–74 years for walking; 20–49 years and 50–64 years for cycling. The age groups for analysis in the National Travel Survey are slightly different from those in the WHO tool and the calculations have been adjusted to account for this.
- A take-up time of 1 year is assumed before the projected level of walking and cycling is reached. The whole assessment period is 10 years, which means that the benefits accumulated over a 10-year period are summed up and presented as an average per year.
- Walking and cycling rates refer to miles of travel per person per day. The tool assumes an average speed of 5.3km/hour for walking and 14km/hour for cycling. The all-cause mortality rates assumed in the model are 434 deaths per 100,000 people for walking and 249 deaths per 100,000 people for cycling.
Further reading
Explore the topics.

Local authority dashboard Explore data for your local authority and neighbourhood
Health inequalities

Money and resources Poverty | Income | Debt

Work Quality | Unemployment | Security

Housing Affordability | Quality | Stability | Security

Transport Active travel | Social exclusion | Trends

Family, friends and community Personal relationships | Community cohesion
Share this page:
This is part of Evidence hub: What drives health inequalities?
Health Foundation @HealthFdn
- Work with us
We look for talented and passionate individuals as everyone at the Health Foundation has an important role to play.
The Q community
Q is an initiative connecting people with improvement expertise across the UK.
Quick links
- News and media
- Events and webinars
Hear from us
Receive the latest news and updates from the Health Foundation
- 020 7257 8000
- [email protected]
- The Health Foundation Twitter account
- The Health Foundation LinkedIn account
- The Health Foundation Facebook account
Copyright The Health Foundation 2024. Registered charity number 286967.
- Accessibility
- Anti-slavery statement
- Terms and conditions
- Privacy policy

Healthy Cities Toolkit
Global Centre on Healthcare and Urbanisation, Kellogg College
Active travel
Moderate positive impact based on uncertain evidence with low resource implications
Cite as Heneghan C, Onakpoya I. Active Transport. Oxford Healthy Cities Toolkit
- Access data
Description
Active travel, also described as active transport or transportation, is defined as making journeys that involve a level of physical exercise [UK Dept for Transport, 2022 ].
It can include walking, cycling, skating or skateboarding (to name a few) and is highly favourable when commuting to work or school. In the literature, active travel was measured using self-reported instruments, surveys or questionnaires, interviews or focus groups, accelerometry, digital tracking devices or GPS.
Fourteen reviews considered the health impacts of active transport involving nearly 500 primary studies. Overall, active travel had a positive effect on increasing rates of physical activity, reducing non-communicable diseases, and improving mental health.
Designing community environments that make active travel convenient, safe, attractive, cost-effective, and environmentally beneficial is likely to produce the greatest impact.
The included reviews represented the ages of the general population, with one review focusing on children and young people [Audrey 2015 ], and two reviews on older people [ Barnett 2017 ; Graham 2020 ].
Three reviews restricted their geographical scope, with one review from the UK [ Graham 2020 ]’ Korea [ Kim 2019 ] and Latin America [ Gomez 2015 ].
Most (85%) reviews assessed rates of physical activity and examined the relationship of the urban environment in promoting active transport. Factors that supported active travel include:
- Adequate infrastructure (e.g. cycle lanes) and connection/continuity of cyclable and walkable surfaces [ de Carvalho 2012 ; Gomez 2015 ; Mölenberg 2019 ; Rachele 2019 ; Sallis 2015 ; Smith 2017 ; Stankov 2020 ]
- Smaller and calmer car traffic, offering greater safety for cyclists and pedestrians [ de Carvalho 2012 ; Gomez 2015 ]
- Short distances of trips [de Carvalho 2012 ; Gomez 2015 ; Sallis 2015 ; Stankov 2020 ]
- Aesthetics of the streets and facilities (cleanliness, low noise, presence of trees/greenery) [ de Carvalho 2012 ; Rachele 2019 ; Sallis 2015 ]
- Mixed land use, combining residential, commercial, and leisure spaces and facilities within a concentrated area [ Gomez 2015 ; Kim 2019 ; Rachele 2019 ; Sallis 2015 ]
- The financial cost and economic benefits [ de Carvalho 2012 ; Sallis 2015 ]
- The environment and sustainable mobility [ de Carvalho 2012 ; Gomez 2015 ; Sallis 2015 ]
Factors that discouraged cycling were related to geography (e.g. weather or terrain) and individual factors (e.g. age, sex, education levels). The lack of connectivity of cycling routes, zoning and land use distribution, and low petrol prices encouraged individuals to use cars. [ de Carvalho 2012 ]
Factors that both encouraged and discouraged active travel were dependent on socio-economic conditions and economic development, which drove the adoption of public policies. [de Carvalho 2012 ]. For example, in Australia, lower economic status was a factor that reduced the use of bicycles by children attending schools, whereas, in Brazil, lower socio-economic profiles were linked to higher rates of active travel when commuting to schools.
For children and young people, multi-component and single-component interventions deployed at schools increased students’ activity levels and reduced parental driving [ Audrey 2015 ]. Factors such as distance from home to school, infrastructure improvements (e.g. cycle lanes, calming traffic schemes), education, and non-car use at baseline influenced active travel.
For older adults, neighbourhood walkability, access to destinations and services and recreational facilities, crime/personal safety, residential density, walk-friendly infrastructure, street lighting, the presence of greenery and aesthetically pleasing scenery were positively associated with physical activity and walking. [ Barnett 2017 ; Rachele 2019 ]. In the UK, cost, availability, connectivity and infrastructure, such as benches and bus shelters, were crucial in enabling active travel among elderly individuals [ Graham 2020 ].
One review identified positive effects for people with diabetes, cardiovascular disease, breast and colon cancer, and dementia, as well as all-cause mortality and the incidence of overweight and obesity [Xia 2013 ].
One review focused on mental health and found that people who actively commuted to work (cycling/walking) reported improved mental health outcomes, but this effect was reduced after baseline mental health was accounted for [Moore 2018 ].
One review examined policies to promote active travel, which found that infrastructure is at the core of promoting active travel, but policies may work best when implemented in comprehensive packages [ Winters 2017 ].
Strength of the evidence
Strength of the evidence
Three reviews used a tool to assess the risk of bias or quality, which had moderate [ Barnett 2017 ], low [Moore 2018 ] and very low-quality evidence [ Audrey 2015 ].
The remaining 11 reviews were ranked uncertain, giving an overall rating of uncertain evidence.
Despite the uncertainty in the quality of the evidence, action should not be postponed until stronger evidence is developed, as the health, environmental, and economic benefits of active travel are clear.
Searches for evidence were conducted between 2010 and 2019 in a median of six databases. Ten of the included studies were formal systematic reviews (two with meta-analyses, one using mixed methods, and one with qualitative studies), three were literature reviews, and one was an overview of systematic reviews.
Resource Implications
Resource Implications
Resource implications were graded low because of the extent of the co-benefits afforded by active travel. In addition to positive health outcomes, reviews reported the economic and environmental benefits, including reducing traffic congestion, accidents, and air and noise pollution [ Graham 2020 ; Sallis 2015 ; Smith 2017 ; Winters 2017 ; Xia 2013 ].
One review estimated the combined economic benefit of eliminating short motor vehicle trips in 11 metropolitan areas in the upper mid-western USS to exceed $8 billion/year [ Xia 2013 ].
Micro-level interventions that increase attractiveness and convenience for active travel are low-cost and easier to implement than macro-level interventions for street design and layout [ Barnett 2017 ; Winters 2017 )].
The rising costs of car transport and petrol prices have reportedly increased the uptake of active travel [ de Carvalho 2012 ; Mölenberg 2019 ]. The implementation of economic incentives, such as congestion and parking fees, was found to promote active travel and significantly improve health [Stankov 2020 ].
Recommendations
- Increase investment in infrastructure for pedestrians and cyclists to promote active travel.
- Use interdisciplinary teams involving those from the transport, planning, public health, and policy sectors should embrace opportunities to implement and evaluate active transport interventions.
- Invest in high-quality research, adjusting for residential self-selection, conceptually-driven choosing of built environmental attributes, and adjusting for key socio-demographic covariates.
- Research is needed to identify the optimal density threshold that supports active travel, which is important for informing planning policy and practice.
Related Resources
Related sources
- WHO (2018): Global Action Plan on Physical Activity 2018-2030 – More Active People for a Healthier World
- WHO (2020): Physical activity
- UK Department for Transport (2022): Active Travel – Local authority toolkit (guidance)
- UK Department for Transport (2020): Cycling and walking plan for England (policy paper)
- UK Department for Transports (2019): Future of Mobility – urban strategy (policy paper)
- Public Health England (2016): Active travel – a briefing for local authorities
- Healthy Places by Design (2001-2008): Active Living by Design
- Sustrans (2017): Active Travel Toolbox
- Open Streets Project
- Active Living Research: Tools and Resources
- Living Streets: UK Charity for Everyday Walking
- Choose how you move: A smarter way to travel in Leicester and Leicestershire
- Transport Scotland: Walking and cycling
- Imperial College London: Active travel
- National Walk to Work Day: UK Public Health Network
References to Reviews
References of Reviews
Audrey 2015. Healthy urban environments for children and young people: A systematic review of intervention studies. Health & place 36: 97–117.
Barnett 2017. Built environmental correlates of older adults’ total physical activity and walking: a systematic review and meta-analysis. The international journal of behavioral nutrition and physical activity 14(1): 103.
de Carvalho 2012. Cycling to achieve healthy and sustainable alternatives . Ciencia & saude coletiva 17(6): 1617–1628.
Gomez 2015. Urban environment interventions linked to the promotion of physical activity: a mixed methods study applied to the urban context of Latin America. Social science & medicine 131: 18–30.
Graham 2020. Older people’s experiences of everyday travel in the urban environment: a thematic synthesis of qualitative studies in the United Kingdom. Ageing & Society 40(4). Cambridge University Press: 842–868.
Kim 2019. How Does the Built Environment in Compact Metropolitan Cities Affect Health? A Systematic Review of Korean Studies. International journal of environmental research and public health 16(16). DOI: 10.3390/ijerph16162921 .
Mölenberg 2019. A systematic review of the effect of infrastructural interventions to promote cycling: strengthening causal inference from observational data. The international journal of behavioral nutrition and physical activity 16(1): 93.
Moore 2018. The effects of changes to the built environment on the mental health and well-being of adults: Systematic review. Health & place 53: 237–257.
Rachele 2019. Neighbourhood built environment and physical function among mid-to-older aged adults: A systematic review. Health & place 58: 102137.
Sallis 2015. Co-benefits of designing communities for active living: an exploration of literature. The international journal of behavioral nutrition and physical activity 12: 30.
Smith 2017. Systematic literature review of built environment effects on physical activity and active transport – an update and new findings on health equity. The international journal of behavioral nutrition and physical activity 14(1): 158.
Stankov 2020. A systematic review of empirical and simulation studies evaluating the health impact of transportation interventions. Environmental research 186: 109519.
Winters 2017. Policies to Promote Active Travel: Evidence from Reviews of the Literature. Current environmental health reports 4(3): 278–285.
Xia 2013. Co-benefits of replacing car trips with alternative transportation: a review of evidence and methodological issues. Journal of environmental and public health 2013: 797312.
Climate & Environment at Imperial
Insights from staff and students across Imperial working in climate and environment related areas
Active travel: good for body, mind and the environment

Dr Madeleine Morris , Research Associate at the Grantham Institute, blogs on why walking and cycling is the way forward when it comes to local travel.
As the UK begins to emerge from lockdown, there has been much discussion about how we travel within our towns and cities, particularly for those who are returning to work. The Government is urging everyone to avoid public transport wherever possible to limit the spread of COVID-19, and to instead take alternative forms of transport. However, if everyone who normally took public transport were to jump in their cars there would be serious problems; cities could come to a standstill, pollution levels would rise significantly, and there could be an increase in injuries to road users and pedestrians alike.
‘Active travel’ – i.e. taking journeys by physically active means, like walking and cycling – is an excellent option for many people. It can reduce the risk of spreading viruses and has multiple benefits for the climate and public health. Local authorities across the UK are transforming streets to make them more accessible for pedestrians and cyclists. The Mayor of London, for example, has launched Streetspace , which aims to widen pavements and give much more space to new cycle lanes. So, there’s never been a better time to start!
I started cycling to work about five years ago because my commute was crowded, expensive and frequently delayed by late running or cancelled trains. The direct benefits for me were a more reliable and pleasant commute at a fraction of the cost, but since then I’ve taken note of the many other benefits, both direct and indirect, that come with active travel.
Big climate benefits
Road transport is responsible for around a fifth (21%) of the UK’s total greenhouse gas emissions. Switching to active travel modes, even for some of our journeys, is one of the most immediate and accessible ways to address this.
Better use of space
The average car is stationary for 95% of its lifespan. Fewer cars on the road means less space required to park them, so more land can be devoted to green space. ‘Parklets’, small parks that take the place of one or two parking spaces, can bring green space to our roadsides and urban areas. This would not only improve air quality but also help build community spirit by providing areas for people to come together on their doorsteps.
These green spaces can even help to keep cities cool and reduce flood risks by absorbing excess rain water. Implementing them at a larger scale, then, could help cities adapt to extreme weather made worse by climate change .

Cleaner air
Air pollution is the fourth biggest killer in the world, contributing to more than six million deaths every year. It is estimated that, on average, four Londoners – including one child – are hospitalised every day due to asthma caused by air pollution. Although avoiding roads with heavy traffic is beneficial, even London’s green spaces are affected by pollution. More than a quarter of the city’s parks , playgrounds and open spaces exceed international safety limits for air quality.
This puts huge pressures on our health- and social-care services. If we don’t reduce pollution levels, the costs to the NHS and social care in England alone could reach as much as £18.6 billion in the next 15 years . Now, more than ever, the importance of reducing pressures on these essential services has been made clear.
Switching to active modes of travel like walking and cycling are simple ways that many of us can contribute to cleaning up the air in our communities.
Good physical health
As well as allowing us to breath cleaner air, walking and cycling benefits our physical health by keeping us active. Many of us increasingly spend most of our time sitting down (especially at work), yet long-term physical inactivity has been shown to have negative effects on our health . Research shows that people who cycle to work, could reduce their chances of early death and cancer diagnoses.
In fact, the health benefits of cycling are so great that they outweigh any negative impacts of being more exposed to air pollution from surrounding vehicles. For me, an added bonus is that travelling by bike frees up time I would otherwise (begrudgingly) put aside to ‘do exercise’ to stay healthy. Who doesn’t love having more free time?
Healthy body, healthy mind
The last couple of months have shown us how important it is to take care of not just our physical health, but our mental health and wellbeing. Avoiding public transport could leave us feeling out of control and stranded from our friends, families and activities we enjoy. Cycling and walking can help us stay connected and, at the same improve our health. A study of seven European cities found that people who cycle in cities have better mental health, and feel less stressed and lonely, than those who travel by car or public transport. And it’s better for the planet.
For more on active travel, check out my top tips to get on your bike and enjoy cycling in the city .
For the latest news, views and events from the Grantham Institute, sign up to our weekly update newsletter .
Share this:
- Click to share on Twitter (Opens in new window)
- Click to share on LinkedIn (Opens in new window)
- Click to share on Facebook (Opens in new window)
- Click to email a link to a friend (Opens in new window)
Published by Grantham Institute
Climate change and environment institute at Imperial College London, one of the world's leading research universities. View all posts by Grantham Institute
Leave a Reply Cancel reply
Discover more from climate & environment at imperial.
Subscribe now to keep reading and get access to the full archive.
Type your email…
Continue reading

9 benefits of active commuting that will convince you to ditch the drive
D oes getting to work for you mean hours of sitting, mindless snacking and sipping on syrupy coffee in crowded trains or white knuckle traffic while you dream of the weekend so you can get back out in your hiking boots ? A 2021 study from Stockholm has revealed the damaging effects of commuting on health, such as physical inactivity, obesity and disturbed sleep, but for many of us, it doesn’t have to be that way. If you already love the outdoors, why not turn your commute into an active adventure on foot or bike? You can reap some incredible benefits for your health, your bank balance and the planet. Read on to discover nine great reasons to turn your commute active and some tips for getting started.
1. It can help you meet – or surpass – your activity goals
Even if you consider yourself really active, if you sit down to commute and you’re relying on trail time or gym sessions after work to meet your daily activity goals, it can be all too easy to have a hard day at the office, skip the gym and not get any physical activity that day whatsoever. You might think you’re going to make it all up on Saturday with a long hike, but then the weather thwarts your plans and before you know it, you’ve missed out on several days worth of exercise.
If your commute involves even 30 minutes of walking each way, however, you’ve already met the recommended daily allowance of exercise as recommended by the World Health Organization . If you actively commute to work and get in your evening workout on top, you’ve just banked even more activity hours to counter all that time spent sitting at work.
2. It reduces your risk of disease
According to the WHO’s recommendations, meeting their minimum daily allowance of physical activity is proven to help prevent and manage noncommunicable diseases such as heart disease, stroke, diabetes, several cancers and hypertension while helping you to maintain a healthy body weight. Those are some serious dividends for simply opting for a different mode of transport, and don’t worry that your commute is too short – University of Cambridge researchers recently concluded that as little as 11 minutes of brisk walking a day is enough to lower your risk.
3. It can save time
Walking or running to work might seem nuts if it would take you an hour and you can catch the train and be there in 15 minutes – how can that save you time? But think about it this way: in the active model, you could leave the house around 8am and be home by 6pm, and have finished both your work and your workout(s) for the day. You’ve got the whole evening ahead of you to spend with family, cook, socialize or practice your needlepoint if that floats your boat.
In the passive model, you’re beholden to the possibility of traffic jams or the schedules of public transport. Even if it’s a 15 minute journey to work, chances are you don’t leave the house at 8:45am. In fact, you probably leave at roughly the same as you would if you were going on foot or two wheels (you want to grab that coffee to make the commute tolerable, after all) and get home at about the same time, only you still need to work out.
4. You can use your commute as training
You can definitely use an active commute as a way to meet the minimum physical activity recommendations and you’d see loads of benefits, but if you’re in training for a specific goal or event, like a half marathon , you can use your commute as part of your training. If your commute is on the long end, run it on Monday and Friday as your long run. If it’s shorter, do it more frequently and make it your easy or recovery run. In other words, make it about the activity itself, and not just the destination.
5. It’s good for your mental health
The physical benefits alone are probably persuasive enough for you to ditch the bus from time to time, but it also has been shown to have a positive impact on your mental health. A 2014 study on nearly 18,000 commuters found that switching from car to active travel improved psychological wellbeing, and showed that while a longer car commute decreased feelings of wellbeing, a longer walking commute further increased wellbeing.
6. You get that morning sunlight
At almost any time of the year, an active commute to work means you can get the benefits of morning sunlight , which can boost your vitamin D levels, reset your body clock and give you the anti-inflammatory benefits of those early morning (and evening) red rays.
7. It saves money
In a time where the price of everything is soaring, you might be looking to save money wherever possible. Cutting back on that tank of gas a week, parking fees, monthly bus passes or multiple train tickets can really add up quickly, plus you might save on those comfort items like lattes and newspapers that you rely on to comfort you during your train or bus journey. With all that extra money you can definitely treat yourself to a pair of new running shoes or a swanky GPS watch for all those extra miles you’re putting in!
8. The air is cleaner outside
If your commute takes you through a built-up area, you wouldn’t be the first to think that the air inside your car is safer than all those exhaust fumes outside, but a 2022 study by the University of Leicester found that the exact opposite was true. In fact, commuting by car in urban areas during rush hour can actually result in larger concentrations of pollutants for driver and passengers inside the vehicle compared to walkers or cyclists making the same journey. Get out and breathe the fresher air!
9. It helps the environment
Speaking of all those exhaust fumes, needless to say that ditching the car reduces your carbon footprint and helps the environment too, and that's something you can feel really good about. Public transportation is definitely a better option than driving or carpooling, but nothing is greener than hopping on your bike or pulling on your running shoes.
How to get started as an active commuter
If you’re ready to give active commuting a go, you need to decide how you’re going to get there – will you walk, run, bike, or do something wild like roller blade or cross country ski? It might take a little trial and error, so leave plenty of time for your first journey and take some time planning your route.
In planning your route, you might just go for the most direct pathway, but consider making use of rec paths such as riverside and canal paths where you can get away from the traffic, stick to safer, well-traveled routes and consider going through green spaces like parks for a nature fix, too.
There is some gear that’s worth investing in to make your active commute comfortable, too:
1. Activity-specific backpack
You might not need to carry all the usual gear you need for a hike or trail run, but you’ll probably need to bring your work clothes and possibly your laptop, so invest in a running backpack like the Montane Trailblazer LT 20 if you’re going fast, a hiking backpack such as the Osprey Talon Earth 22 or a backpack that’s suited to your activity and expands to fit your gear.
2. Waterproof gear
Getting soaked isn’t as dangerous heading through town as it is at 14,000 feet above sea level, but arriving at work looking like a drowned rat might not be your ideal start to the work day. Get an activity-specific waterproof jacket like the North Face Lightriser Futurelight for running or the Montane Phase Lite for walking that will seal out a downpour, pack down small if it’s sunny and can go with you up a hill too.
It can be a good idea to stash a microfiber camping towel at the office too so that whether you get drenched or take a shower upon your arrival, you can towel off and it will dry quickly for next time.
3. Great footwear
If you’re heading to work on foot, it’s worth investing in good footwear to support your joints. Check out the best road running shoes for tarmac surfaces whether you’re planning on running or walking – you can leave your loafers or ballet flats at the office and change into them when you arrive.

Cookies on GOV.UK
We use some essential cookies to make this website work.
We’d like to set additional cookies to understand how you use GOV.UK, remember your settings and improve government services.
We also use cookies set by other sites to help us deliver content from their services.
You have accepted additional cookies. You can change your cookie settings at any time.
You have rejected additional cookies. You can change your cookie settings at any time.
- Driving and road transport
- Cycling and walking
Active travel: local authority toolkit
- Department for Transport
Updated 10 August 2022
Applies to England

© Crown copyright 2022
This publication is licensed under the terms of the Open Government Licence v3.0 except where otherwise stated. To view this licence, visit nationalarchives.gov.uk/doc/open-government-licence/version/3 or write to the Information Policy Team, The National Archives, Kew, London TW9 4DU, or email: [email protected] .
Where we have identified any third party copyright information you will need to obtain permission from the copyright holders concerned.
This publication is available at https://www.gov.uk/government/publications/active-travel-local-authority-toolkit/active-travel-local-authority-toolkit
Walking, wheeling and cycling are the least carbon-intensive ways to travel.
However, walking currently accounts for only 5% of the total distance travelled in England. Around 49% of trips in towns and cities under 5 miles were made by car in 2021, with around a quarter of all car trips in England less than 2 miles.
Many of these trips could be walked, wheeled or cycled, which would help to reduce the 68 megatons ( Mt ) carbon dioxide equivalent (CO2e) emitted from cars in 2019. This would benefit local economies, as well as improve people’s health.
More active travel will also make roads quieter, safer and more attractive for people to walk, wheel and cycle – a virtuous cycle.
As we decarbonise transport, making all cars, public transport and heavy goods vehicles (HGVs) zero emission is part of the solution, but relying solely on zero emission road vehicles isn’t enough.
Road traffic, even on pre-COVID-19 trends, was predicted to grow by 22% from 2015 to 2035, much of it in cities where building new roads is physically difficult and disadvantages communities.
As set out in the second cycling and walking investment strategy (CWIS2), the government wants walking, wheeling and cycling to be the natural first choice for shorter journeys or as part of longer journeys.
Local authorities can play an important role in increasing walking, wheeling and cycling. Through influencing planning and taking a wider, strategic view of travel infrastructure across their area, authorities can ensure that active travel infrastructure connects residents to services.
As local leaders, authorities have a wide sphere of influence and can lead by example in adopting, promoting and providing infrastructure to enable and encourage active travel with their staff.
Authorities can also work with local businesses, industrial estates and business improvement districts to design specific interventions and behaviour change programmes to enable active travel with their employees and customers.
The primary actions for local authorities are to:
- develop Local Cycling and Walking Infrastructure Plans (LCWIPs)
- develop and implement Travel Demand Management Plans
- plan for and improve active travel infrastructure
- promote behaviour change to enable active travel
What active travel means
Active travel refers to modes of travel that involve a level of activity.
The term is often used interchangeably with walking and cycling, but active travel can also include trips made by wheelchair, mobility scooters, adapted cycles, e-cycles, scooters, as well as cycle sharing schemes (adapted from the definition in the Future of Mobility: urban strategy .
Wheels for Wellbeing explains that cycling includes a wide range of cycle types, including:
- recumbent tricycles
- cycles for 2 (tandem, side by side, wheelchair tandem and duet bikes)
Recent changes in active travel
The 2021 National Travel Survey found that the number of walking trips remained at a similar level to 2020, which is below the level seen in recent years prior to the pandemic. Whilst overall levels of walking have fallen in recent years, people are choosing to walk further, with walking trips of over a mile remaining higher than pre-pandemic years.
Cycling decreased back towards pre-pandemic levels, following a peak during 2020. The National Travel Survey reported that:
- 47% of people over 5 years had access to a pedal cycle, the same level as 2020
- less people (a decrease of 27%) cycled for part of their trip, and the average number of trips by cycle decreased by 27%
- following the peak of average miles cycled per person in 2020, average miles decreased by 37% in 2021 – bringing it back to pre-pandemic levels
Wave 5 of the National Travel Attitude Survey focused on cycling with:
- off-road and segregated cycle paths (55%), safer roads(53%) and well-maintained surfaces (49%) the most common measures that respondents said would encourage them to cycle more
- 64% supporting the creation of dedicated cycle lanes, at the expense of road space for cars
E-cycles are growing in popularity and make cycling accessible to more people, build users’ confidence and enable cycling in more challenging terrain.
The definition of e-cycle includes all electrically assisted pedal cycles, electric cycles, e-bikes and e-trikes.
E-cycles offer assistance only when the rider is pedalling and must comply with the electrically assisted pedal cycles (EAPCs) regulations .
To be classified as an EAPC and not treated as a motor vehicle, when used on roads, a cycle fitted with an electric motor must comply with the requirements of the EAPC Regulations 1983. Specifically:
- it must be fitted with pedals that are capable of propelling it
- the maximum continuous rated power of the electric motor must not exceed 250 watts
- electrical assistance must cut off when the vehicle reaches 15.5 miles an hour
Cycle sharing
Cycle sharing describes any setting where cycles can be borrowed by the public or an employee (for workplace schemes).
Cycle sharing schemes can be an effective way to re-engage people in cycling – in CoMoUK’s 2021 bike share report nearly half of the 4,000 respondents said that joining a scheme was a catalyst to them cycling for the first time in at least a year, and 24% of them had not cycled for 5 years or more.
CoMoUK offers more information and guidance on cycle sharing schemes and identifies different scheme types:
- public – growing rapidly, these can include e-cycles. They integrate well with other modes of transport and are established in Belfast, Brighton, Cardiff, Glasgow, Liverpool and London and smaller locations such as Hereford, Guildford, and Stirling. Existing schemes in the UK can be found on CoMoUK’s map
- station-based – cycles are located at train stations and at various points across the town or city, at staffed or unstaffed hubs, docking stations or in a geo-fenced area. Some can be returned to any dock and others must be returned to the starting location
- free-floating – where cycles can be left anywhere within the urban boundary, often with guidance on not causing obstructions when parking
- cycle libraries – allow users to rent cycles for short periods and include cycle hubs in community locations (such as libraries and sports centres)
- peer-to-peer – where owners rent their cycle out for a fee
- pool cycles – generally housed at workplaces or community locations and borrowed by members of staff or the community. These schemes may share public facilities such as cycle storage
Implementing active travel: cycle sharing in Scotland
In 2020, the grant programme Paths for All, Smarter Choices, Smarter Places , in Edinburgh and Glasgow, worked to increase the uptake of cycle-sharing. This generated almost 18,000 new users and a 38% increase in trips in 3 months.
Users reported an improvement in their physical and mental health, and 10% went on to buy their own cycle. Further details are available from CoMoUK .
The benefits of active travel
Encouraging mode shift to walking, wheeling and cycling is one of the most cost-effective ways of reducing transport emissions, as outlined in the transport decarbonisation plan.
Walking, wheeling and cycling can decrease congestion, air and noise pollution, and both are linked to health and economic benefits.
Friends of the Earth produced a briefing on the role and benefits of segregated cycleways and e-cycles in urban areas. They report that improvements could deliver benefits for health, carbon and local economies, and make recommendations to maximise the effectiveness of funding.
Carbon emissions and air pollution
Sustrans, the national travel charity, estimates that 28,000 to 36,000 early deaths occur each year in the UK due to air pollution worsening heart and lung disease. They report that 80% of roadside nitrogen dioxide ( NO2 ) pollution is from road transport where limits are being broken.
As more of our short journeys (48% of all trips in urban towns and cities are under 2 miles) are walked or cycled, the carbon, air quality, noise and congestion benefits will be complemented by significant improvements in public health and wellbeing.
It is estimated that active travel can deliver between 1 MtCO2e and 6 MtCO2e savings from 2020 to 2050 in the transport decarbonisation plan.
In cycle share schemes, an average of 53kg of CO2e are saved per cycle share user each year according to CoMoUK’s 2021 bike share report .
Active travel can reduce the proportion of people driving children to school by up to 33%. Through projects such as the Big Pedal , 8.5 million car miles could be saved, resulting in a decrease of 2,500 tCO2e and reductions in NO2 levels.
Future active travel spending is expected to deliver £20 million to £100 million savings from air quality improvements as well as providing opportunities to improve green space and biodiversity.
Physical health
Physical inactivity costs the NHS up to £1 billion each year , with additional indirect costs of £8.2 billion according to a report by the Department for Transport ( DfT ) in 2014 on the economic benefits of walking and cycling . This report also highlights a link between adult obesity levels and travel behaviour as countries with the highest levels of cycling and walking generally have the lowest obesity rates.
In Growing Cycle Use , the Local Government Association ( LGA ) reports that if cycling rates were elevated to London levels across other UK cities, this would avoid at least 34,000 incidences of 8 life-threatening conditions between 2017 and 2040.
Regular commuting by cycle is linked to a lower risk of cancer or heart disease compared to other forms of transport. This may be partly due to cyclists and walkers being exposed to less air pollution than drivers and passengers inside vehicles on the same routes.
In the 2021 bike share report , CoMoUK found that 20% of cycle share scheme users said that if formed ‘all’ or a ‘major part’ of the physical activity they undertook.
Sustrans identifies further health benefits: a 3-mile commute will achieve recommended levels of activity each week.
The Energy Saving Trust reports that walking strengthens muscles, lungs, bones and joints.
Physical activity has also been shown to reduce incidences of heart disease, asthma, diabetes and cancer , as well as benefiting those with bad backs.
Mental health
Exercise can protect against anxiety and depression, according to the NHS . Any exercise is beneficial but exercising outdoors can have additional benefits.
Research in the British Medical Journal suggests that exercise can also help reduce stress . Guidance from the UK Chief Medical Officers’ on physical activity suggests that 30 minutes of moderate activity per day almost halve the odds of experiencing depression .
Gear Change states that completing 20 minutes of exercise each day cuts the risk of depression by 31% and increases worker productivity.
Economic benefits
Increasing active travel will reduce road congestion, particularly at peak times, leading to increased productivity and improved movement of goods and services. Sustrans estimates that congestion costs £10 billion per year in 2009 in urban areas, and that this cost could rise to £22 billion by 2025.
Living Streets’ Pedestrian Pound report outlined a range of economic benefits of walking, including that well-planned walking improvements can lead to a 40% increase in shopping footfall.
The LGA highlights how, after a Canadian council reallocated high street parking as bike lanes or cycle parking for a year, businesses benefitted from increased footfall (20% increase), spend (16% increase) and increased frequency of return visits (13% increase).
The Transport decarbonisation plan states that cycle manufacture, distribution, retail and sales contribute £0.8 billion per year to the economy and support around 22,000 jobs.
For organisations
As an employer, promoting active travel can help with corporate social responsibility, reduce the impact of business traffic (including commuting) locally and reduce demand for parking spaces.
Active travel can also improve the health and wellbeing of staff, increase productivity and motivation, and aid the recruitment and retention of skilled workers. More information is available on the Sustrans website .
Actions for local authorities
Local authorities are well placed to plan and provide space for inclusive active travel infrastructure and accompanying behavioural change programmes. For Local Transport Authorities (LTAs) and combined authorities, doing so is part of their responsibilities on highways and road safety.
The LGA , as part of their decarbonising transport series, produced guidance on how authorities can grow cycle use. They note that measures will be most effective if implemented as part of a comprehensive active travel plan, integrated with wider transport, climate and housing strategies.
The final evaluation report of the Cycle City Ambition programme makes suggestions for local policymakers and practitioners on the most effective ways to increase active travel. It found that improving infrastructure is effective in increasing cycling and improving health equity, but requires significant investment and may take some time for impacts to be fully realised.
Sustrans can assist local authorities to develop active travel policy and guidance. It can also help promote active travel and provide feedback on walking and cycling schemes. Its website has sections for professionals, policy, and a resource library to enable authorities to make the case for active travel.
Living Streets can offer specialist advice and support for local authorities on enabling walking, including school and community engagement and infrastructure design.
Wheels for Wellbeing is a national charity that supports disabled people to access and enjoy cycling. As part of its Infrastructure for All campaign , it has highlighted the most significant barriers to cycling for disabled cyclists, including inaccessible cycling infrastructure and inadequate facilities to secure adapted cycles.
It recommends that authorities looking to install or upgrade cycling infrastructure follow LTN 1/20 – Cycle Infrastructure Design Guidance or the London Cycling Design Standards inclusive cycle concept.
Wheels for Wellbeing has published a Guide to Inclusive Cycling that promotes best practice in designing inclusive cycling infrastructure.
Implementing active travel: Greater Manchester
Using funding from the Cycle Cities Ambition programme, Greater Manchester built 3 miles of cycle lanes along one of the city’s busiest bus routes in 2017 .
Infrastructure installed included a mix of on-road and fully segregated cycle lanes and shared-use paths, along with 26 bus stop bypass lanes for cyclists.
The cycling measures were planned as part of a holistic design to improve the environment and maximise opportunities for cycling, walking and improved bus travel along the corridor.
The overall scheme included widened footways and improved crossing facilities for pedestrians and the removal of general traffic from a section of the road at certain times of day, improving bus journey time reliability. Mitigation measures to address traffic displacement onto parallel routes were also introduced.
Surveys found that in 2018, cycling 2 miles from the city centre was up 85% against a 2015 baseline.
For 2018, analysis identified more than a million journeys along one section of the route, saving an estimated 873.5 tonnes of CO2 .
1. Develop a Local Cycling and Walking Infrastructure Plan
Local Cycling and Walking Infrastructure Plans (LCWIPs) are part of the 2017 cycling and walking investment strategy .
Although not mandatory, their aim is to help authorities in England take a strategic approach to improving conditions for walking and cycling and ensure that consideration is given to walking and cycling within local planning and transport policies.
Developing an LCWIP will help an authority make a strong case for future investment in active travel infrastructure. DfT has produced guidance and tools on developing an LCWIP .
The main outputs from an LCWIP are a:
- mapped network plan for walking, wheeling and cycling that identifies preferred routes, current and future travel patterns, and core zones for further development
- prioritised programme of infrastructure improvements for future investment in the short, medium and long term that contributes towards meeting broader local goals
- report that sets out the underlying analysis, including the barriers and enablers for walking, wheeling and cycling, and provides a narrative to support the improvements identified
As of September 2020, 45 of the 46 local authorities that took part in the original DfT LCWIP pilot scheme had submitted an LCWIP.
Cycling measures, infrastructure and networks identified in an LCWIP should follow the best practice guidance in Local Transport Note 1/20 on delivering high-quality cycling infrastructure.
Authorities can ensure that new infrastructure is inclusive by following the Wheels for Wellbeing guidance .
Wave 5 of the National Travel Attitudes Survey identified safety as a major concern among those who would like to cycle more often. One action to boost cycling is to provide dedicated road space for cyclists. The development of a network of high-quality, segregated cycling infrastructure, through inclusion in LCWIPs, will encourage growth.
The LGA notes that a mixture of measures is needed alongside segregated infrastructure to develop safe cycling networks , including vehicle speed and volume management.
To support the development of LCWIPs, Sustrans produced a report addressing 9 misconceptions about implementing cycling infrastructure.
For each myth, it provides evidence and sample messages to support a communications campaign and make the case for increased investment in active travel.
On 6 July 2022, DfT published the second statutory Cycling and Walking Investment Strategy (CWIS 2) , which covers the period between 2021 and 2025. The strategy includes new and updated objectives including:
- increasing levels of walking and walking to school
- doubling cycling
- increasing the proportion of journeys in towns and cities that are walked or cycled
It also sets out the funding in place to achieve these objectives.
2. Develop a Travel Demand Management Plan
LTAs in England can assist in encouraging active travel by developing a Travel Demand Management (TDM) plan.
These aim to manage pressure on a transport network under times of heightened demand and uncertainty. An effective TDM plan can contribute data to the development of an LCWIP, as well as strengthen the case for investment.
The DfT toolkit for LTAs on developing TDM plans , produced by Mott MacDonald, can be used to support LTAs in developing TDM plans following COVID-19.
The toolkit also allows authorities to manage other scenarios where there are pressures on the transport network or times of higher demand. The toolkit includes worked scenarios, a template action plan and sample questions to answer during the data-gathering exercise.
To be effective, TDM plans need:
- leadership, support and endorsement from all agencies within the LTA area
- clear identification of the problem and size of the challenge
- range of alternative travel options available
- strength of message to influence travel
- good communication channels to ensure messages reach their intended audience
- focused approach with audience and mode segmentation
- trust and credibility (from the audience) in the quality of information provided
- consistent message across all stakeholders built around the core narrative
- time and resources to implement the plan
- ability to track and monitor impacts
Implementing active travel: TDM in the West Midlands
Transport for the West Midlands (TfWM) developed a TDM programme , including a strategy and delivery plan, in August 2020, in anticipation of pupils returning to school following COVID-19 lockdowns.
TfWM worked with districts and transport operators to implement measures designed to avoid a mismatch between travel demand and supply. Travel planners undertook surveys to identify schools in need of support and produced a toolkit and supporting communications material.
Implementing active travel: TDM in North Yorkshire
North Yorkshire County Council developed a TDM plan to support modal shift from cars to active travel when schools returned from lockdown. It focused on behaviour change to raise awareness of transport options, particularly active travel and road safety.
A brand identity and core messaging were developed, along with a social media content plan to target specific demographics and signpost to resources such as Open North Yorkshire . Since then, 18% of trips have switched to non-car travel – 9% to active travel and 9% to public or school transport.
3. Plan for active travel
As planning and transport authorities, local authorities play a significant role in enabling residents to use active travel modes.
The government’s Transport decarbonisation plan contains a commitment to embed the transport decarbonisation principles in spatial planning and an ambition to make walking, cycling and public transport the first natural choice for journeys.
One of the commitments of Gear Change was the establishment of Active Travel England (ATE) . ATE launched as an executive agency in January 2022, with one of its stated objectives being to improve the provision of walking, wheeling and cycling infrastructure.
ATE will be a statutory consultee in the spatial planning system, approve and inspect walking, wheeling and cycling schemes and support local authorities through the sharing of knowledge and good practice.
As the LGA reports, easy access to destinations such as employment, education, healthcare and leisure facilities, will encourage take-up , as will incorporating green routes, parks and water features into infrastructure. More direct and better connected routes and secure cycle parking at critical points to allow inter-modal journeys, help to extend the reach of cycling.
Sustrans’s Cycling for Everyone report looks at how to improve access to cycling and reduce inequality through improvements to governance, planning and decision-making. It includes recommendations on making cycling more inclusive encompassing scheme design, public engagement and user safety. Arup, Living Streets and Sustrans have also published a Walking for Everyone report, which provides information, advice and recommendations to make walking and wheeling more inclusive. Sustrans have also recently published the results of their Disabled Citizens’ Inquiry into active travel which provides a number of helpful recommendations for local authorities.
Implementing active travel: Levenshulme and Burnage Active Neighbourhood
Sustrans worked with Manchester City Council, Bespoke Transport Consulting, Transport for Greater Manchester and local community groups as part of the Bee Network to create the first ‘active neighbourhood’ in the Levenshulme and Burnage area of South Manchester. An active neighbourhood aims to prioritise the movement of people over motor traffic.
This scheme intends to create an Active ‘filtered’ Neighbourhood, using planters to reduce traffic in the area and encourage residents to use other forms of sustainable transport – particularly walking and cycling.
Consultations are currently underway and the scheme is expected to be completed by March 2022.
Levenshulme and Burnage Active Neighbourhood is now being managed by Manchester City Council.
4. Develop a behaviour change programme for active travel
Authorities can stimulate a shift to active travel for short journeys through effective communication, design and implementation of behaviour change interventions.
As local leaders, planning authorities, transport authorities and employers, authorities can demonstrate best practice by modelling approaches to increase walking, wheeling and cycling and promote the benefits of embedding active travel within staff engagement and carbon reduction plans.
Active Travel behaviour change interventions could include (but are not limited to):
- cycle and e-cycle hire schemes
- business grants to provide facilities or equipment
- travel planning
- cycling skills courses (for children, adults and families)
- walking and cycling engagement events
- school-focused initiatives
- measures to improve cycle security
- measures to tackle inclusion and accessibility barriers
Evidence shows that it is more effective to develop behaviour change and infrastructure projects together, rather than in isolation.
Developing and implementing a programme of behaviour change initiatives for staff and residents will enable use of new infrastructure and reduce reliance on cars.
Growing Cycle Use suggests that local authorities should embed cycling in local culture through integration into school, workplaces and towns.
Designing inclusive approaches that take advantage of, and build on, existing programmes that have high value for money, such as Living Streets’ Walk to School Outreach and Cycling UK’s Big Bike Revival , and engaging with national events, such as Bike Week or Walk to School week, can drive uptake. Initiatives targeted at school-age children especially would help to create a local active travel culture from an early age.
Implementing active travel: gamification to encourage active travel
Research by Cardiff Metropolitan University has highlighted the benefit of combining infrastructure for active travel with novel behaviour change techniques. Beat the Street is an active travel engagement platform that encourages players to use active travel to move around their area, swiping their cards at consecutive locations to earn points.
Evaluation conducted by researchers on levels of active travel before and after intervention found that the number of players doing less than 30 minutes of activity per week decreased by 7% and those reporting more than 150 minutes of activity increased by 13%. The study also reported 53% fewer cars and vans in the morning commute and 33% fewer cars in the afternoon.
For further information on Beat the Street, contact [email protected] .
Cycle training
Providing cycle training for staff and residents can enable greater uptake of cycling through increasing confidence and skill of participants.
The national standard for cycle training describes the skills and understanding needed to cycle safely and responsibly and to enable others to cycle. Any cycle training to support safe cycling on the road should be based on the national standard.
Bikeability cycle training is the DfT -approved and funded method of delivering national standard training. It is a practical training programme, enabling trainees to cycle safely and confidently on today’s roads and learn basic cycle maintenance skills. It must be delivered by trained and registered instructors, registered and quality assured by the Bikeability Trust .
Your local authority may have an in-house team of registered Bikeability instructors or hold a contract with an independent training provider. Contracts are usually managed by road safety, active or sustainable travel teams.
Outside London, DfT provides funding to local highway authorities to deliver Bikeability in schools and the community. Grants for Bikeability training are managed by the Bikeability Trust.
In London, cycle training is funded by Transport for London (TfL) and the boroughs. Scotland and Wales have separate arrangements.
In some circumstances, DfT -funded Bikeability is managed and arranged via a school games organiser ( SGO ) host school, rather than by the local authority. The list of SGOs in receipt of Bikeability grants is available on the Bikeability website.
While Bikeability is primarily associated with children and the majority of Bikeability training is delivered through the school’s programme, the scheme also includes modules aimed at adults and family groups.
Since the programme started in 2007, more than 3 million children have received Bikeability training, and DfT and the Bikeability Trust are working together to develop plans so that every child and adult can take up an offer of training.
Promoting active travel to work
Authorities can lead by example by promoting active travel to their staff and working with local businesses to promote active travel to employees.
Research carried out by the behavioural insights team ( BIT ), working with DfT , sets out to develop policy options to convert high levels of cycling during the COVID-19 pandemic into more long-term travel habits .
The A Moment of Change: Guidance for local authorities on promoting an active return to work focuses on the cycle to work policy option from the BIT research, and provides a comprehensive toolkit to support local authorities in the design, implementation and evaluation of behaviour change programmes that promote an active return to work.
It covers developing, funding and choosing a model for a behaviour change programme, as well as suggested initiatives, case study examples of different interventions and resources to help build a business case and important messages.
Suggested actions from the guidance include:
- ensure your policies support and promote active travel where appropriate
- undertake a travel survey to find out how your staff currently travel and the barriers to active travel or public transport use
- consider developing staff travel plans to identify practical lower-carbon commuting options
- provide safe and secure cycle storage at your offices
- provide e-cycle charging to encourage those with a slightly longer commute to cycle
- provide access to showers for those who choose to run or cycle in. This can be in your office, or at a nearby leisure centre
- appoint an active travel champion. They could organise a bike buddy scheme, coordinate participation in active travel challenges or organise bike maintenance sessions
- sign up to a cycle to work scheme, such as Cyclescheme or the Green Commute Initiative . These are a form of employee benefits that allow staff to purchase cycles and accessories at a reduced cost, which is reclaimed through an employee’s pay
See the Sustrans website for more suggestions.
Tools and funding
Numerous tools from government and research bodies are available to assist local authorities in planning, implementing and assessing active travel infrastructure. They include:
- Active Travel Portal brings together information for local authorities, including case studies, links to documents, policies and research
- Healthy Streets Design Check : published by DfT to support authorities in applying LTN1/20 guidance. The tool measures existing streets and proposed designs to determine how healthy they are
- Propensity to Cycle : a strategic planning tool to help transport planners and policymakers prioritise investments and interventions to promote cycling
- Cycling Infrastructure Prioritisation Toolkit : a collection of tools that provides an evidence base for prioritising infrastructure to promote cycling
- Place-Based Carbon Calculator : estimates a per capita carbon footprint for each lower layer super output area (LSOA), as well as showing roughly 15-minute travel times using different modes
- Active Travel Toolbox : a collection of guides, tools and case studies to help local authorities deliver walking and cycling schemes in their area
- Active Mode Appraisal Toolkit : a spreadsheet-based tool for assessing the overall benefits of walking and cycling interventions. DfT has produced guidance on its use
- The Town and Country Planning Association (TCPA) published an introductory guide to 20-minute neighbourhoods for local authorities in March 2021
Active Travel Portal has a guide to the funding options available to local authorities, including annual allocations that can support active travel, as well as competitive funds.
The UK government’s capability fund was announced in January 2023 and allocated revenue funding to all local authorities (outside London) to enable more walking and cycling in their local areas through developing LTN 1/20 compliant infrastructure plans and undertaking behaviour change activity.
Guidance issued to all authorities as part of the capability fund allocation highlights the need to monitor and evaluate the impact of schemes delivered through the fund. Authorities are required to report their progress and share the findings of their evaluation with Active Travel England.
The capability fund has been followed by a capital grants fund , allocated to authorities based on the quality of the plans developed.
Funding for Bikeability Cycle training in schools and the community in England (outside London) is available from DfT and training is delivered by Bikeability.
Local authorities agree their funding allocation and training activities with the Bikeability Trust at the start of the calendar year.
Any local authority wishing to discuss their allocation should contact the Bikeability Trust in the first instance.
Is this page useful?
- Yes this page is useful
- No this page is not useful
Help us improve GOV.UK
Don’t include personal or financial information like your National Insurance number or credit card details.
To help us improve GOV.UK, we’d like to know more about your visit today. We’ll send you a link to a feedback form. It will take only 2 minutes to fill in. Don’t worry we won’t send you spam or share your email address with anyone.
About Active Travel
Increasing levels of active travel can bring huge benefits to our communities, health and environment. , active travel simply means making journeys in physically active ways - like walking, wheeling (using a wheelchir or mobility aid), cycling, or scootering..
We aim to make active travel the natural choice for short journeys.
By supporting more people in Scotland to walk, wheel, and cycle for everyday short journeys, we will improve health, create safer communities, and reduce environmental impacts.
In 2019 seventeen per cent of journeys in Scotland were under 1 km, and more than half (54%) were under 5 km – these shorter trips offer a real opportunity for a significant shift to active travel.
The role of walking
Walking is key to getting more people choosing to not use car, it is by far the most likely mode of active travel. It is free, no equipment is required and it is ideal for shorter trips. Walking also forms an important part of public transport journeys – walking to and from buses, trams and trains.
The positive impact of increased active travel
Reduced congestion - enabling people to choose active or sustainable travel will reduce congestion on our roads
Reduced air pollution - less car-driven journeys and more walking, wheeling, cycling and public transport are important in tackling air pollution and its negative health impacts. As well as being a part of the solution, active travel becomes more pleasant and therefore more likely to be adopted as air quality improves.
Higher quality public realm - Improving opportunities to walk will create places and communities that are more able to adapt and be vibrant, creative, enterprising, and accessible
Better physical, mental and social health - Active travel has clear health benefits as physical activity increases, social connections are made and mental health is boosted by activity and time outdoors in nature. Active travel is an important opportunity for savings in terms of preventing ill health.
Reducing carbon emissions and helping reach net-zero carbon goals - Changing to active travel can have significant lifecycle carbon emissions benefits. The largest benefits come from shifts from car to active travel for business, social and commuting journeys.
Economic growth and vibrant communities - Investing in infrastructure and support for active travel can increase economic growth and vibrancy. Those walking, wheeling and cycling tend to spend more money locally than drivers. Increasing active travel can stimulate economic growth in urban areas and benefit local shops
- It is inclusive and reduces inequalities - Accessible walking, wheeling, cycling and good public transport links can reduce inequalities by giving equal access to employment, education and other services.
Active travel and COVID-19
The Covid crisis has had significant impacts on active travel with huge decreases in use of public transport and a greater interest in walking and cycling. At the same time many of us have been working from home and recognising the importance of our local neighbourhoods. Other people have lost fitness and confidence to reintegrate and leave their homes and have deteriorated physically.
A number of towns and cities across Scotland implemented and benefitted from a temporary emergency active travel infrastructure initiative called Spaces for People . The initiative included a widening of pavements, closing streets to vehicles or adding temporary cycle lanes.
As Scotland moves forward from the pandemic there has been an opportunity to harness the increases in active travel, support those who have struggled to stay active, and invest in sustainale transport to build a healthier, cleaner, fairer and safer nation.
Also in this section
- Smarter Choices, Smarter Places Programme
- Community Project Transition Fund
- Success Stories
- Active Travel Partners
Stay up to date and join our mailing list
- Media Centre
Find out what we stand for and how our work around the UK is making a difference.
- Board of Trustees
- Paths for Everyone
- In Scotland
- In Northern Ireland
Explore fantastic walking and cycling routes across the UK
Information
- Find a route on the Network
- About the National Cycle Network
- Our future vision
- Find other cycle routes
Inspiration
- Route collections
- Great walks on the Network
- Traffic-free family rides
- Making space for nature on the Network
For professionals
Work in partnership with us to tackle the challenges of congestion, air pollution, physical inactivity, and social inequality, by making it easier for people to walk and cycle.
Policy area
- Policy positions
- The Walking and Cycling Index
- Streets for everyone
- Disabled Citizens' Inquiry
Sector Experience
- Cycling infrastructure
- Urban design and planning
- Research, monitoring and evaluation
- Our approach
Get involved
Your support helps to give children access to the training and equipment they need to ride a bike safely - starting a cycle of good that can go on to benefit their health, education and future.
- Leave a gift in your Will
- Donate in memory
- Corporate partnerships
- Give a virtual gift
Give your time
- Work for Sustrans
- Log in to Assemble
- Fundraising and challenge events
- Become a Sustrans fundraiser
Active Travel Toolkit - The role of active travel in improving health
Published: 21st JULY 2017
Walking and cycling are the most effective ways to promote routine physical activity. In general terms fitter, healthier employees benefit their employer.

The health benefits of active travel
- Health and wellbeing in the workforce
- Air quality
- Mental health
1. How active travel can improve health and wellbeing in the workforce
The costs of absence and presenteeism (working whilst sick which can cause productivity loss, poor health, exhaustion and workplace epidemics) to business, the economy and the employee is too significant to be ignored.
Over the past 60 years, the design of urban environments and transport systems has favoured private motorised transport. Whilst this has bought some benefits, it has also imposed high health and societal costs.
Walking and cycling are the most effective ways to promote routine physical activity. In general terms fitter, healthier employees benefit their employer through:
- Lower turnover rates and reduced absenteeism
- Improved productivity and employee morale
- Lower health care costs
Transport systems and the wider built environment play a crucial role by either promoting or hindering physical activity.
How active travel can improve health and wellbeing in the workforce toolkit contents
- Health benefits of regular physical activity.
- Health costs of physical inactivity for society and employers
- Transport modes, physical activity and health
- Case studies focusing on workplaces and the commuter journey that demonstrates increased physical activity through walking and cycling.
How active travel can improve health and wellbeing in the workforce downloadable resources
How active travel can improve health and wellbeing in the workforce (PDF)
How active travel can improve health and wellbeing in the workforce Slidepack (PDF)
2. Improving air quality by walking and cycling
Air pollution is damaging our environment and our health. Up to 40,000 early deaths are attributable to air pollution each year in the UK and road transport is responsible for 80% of the pollution where legal limits are being broken.
The Avoid (align transport and urban development), Shift (modal shift to active travel and public transport) and Improve (use technology to reduce emissions) approach is a useful framework for reducing air pollution.
Improving air quality by walking and cycling toolkit contents
- The impacts of poor air quality on human health.
- The benefits of modal shift from short car trips to walking and cycling.
- Approaches to improve air quality that encourage modal shift.
Improving air quality by walking and cycling downloadable resources
Improving air quality by walking and cycling (PDF)
Improving air quality by walking and cycling Slidepack (PDF)
3. The role of active travel in improving mental health
Poor mental health is a significant and often poorly understood issue in the UK, with one in six workers experiencing depression, anxiety or problems relating to stress at any one time.
Evidence suggests walking and cycling can contribute positively towards mental health both through physical activity and other factors in comparison to commuting by car.
More needs to be done to improve links between transport, health and wellbeing nationally and locally, including how we account for mental health outcomes in transport planning.
The role of active travel in improving mental health toolkit contents
Financial and personal costs of poor mental health.
- Benefits of physical activity for mental health.
- Benefits of active travel for mental health through the commute.
- Improving links between transport health and wellbeing.
The role of active travel in improving health downloadable resources
The role of active travel in improving mental health (PDF)
Share this page
- The benefits of being active
- The five big issues
- Read our strategy
- Demographics
- By topic/issue
- About our research
- About people
- About places
- Activity Check-in
- Local Area Insights
- Market Segmentation tool
- Innovation and digital
- Cost of living
- Safeguarding
- Facilities and planning
- Grassroots organisers
- Schools and teachers
- National governing bodies
- Digital Marketing Hub
- Image library
- Funding explained
- Other funding options
- Frequently asked questions
- This Girl Can
- We Are Undefeatable
- Play Their Way
- Active Partnerships
- Be Inspired
- Code for Sports Governance
- Commonwealth Games
- Equality and diversity
- Long-term partnerships
- Place partnerships
- Use our School
- Return to play
- Active Design
- Featured content
- News archive
Active travel
Be it walking to school, cycling to work, or other everyday journeys you make to get from place to place – rather than solely for leisure or fitness – active travel can offer a convenient, accessible and affordable way to move more.
At a glance
- Our research
Tools and resources
Increasing levels of physical activity is central to improving the nation’s health and wellbeing, and active travel - which is the everyday journeys we make to get from place to place, like cycling to work - is widely viewed as having the potential to play a major part in that mission.
The evidence base on the link between active travel and physical activity is extensive, wide-ranging in terms of the interventions reviewed, exhibits variable degrees of rigour, and can be interpreted in different ways. In particular, the volume of available material has grown considerably in recent years and are expected to continue to grow in coming years.

Our strategy - Uniting the Movement
Uniting the Movement, our 10-year strategy launched in 2021, is our plan to make being physically active a normal part of life for everyone in England – to make it easier for all of us as we go about our everyday lives.
Movement makes people happier and healthier, and it does the same thing for our communities – with life-changing, sustainable benefits that have huge economic and social value.
We’re shining a light on the huge impact environmental prompts and cues can have in changing people’s behaviour, which is why we’re championing Active Design alongside active travel.
Active Design promotes physical activity, health and stronger communities through the way we design and build our towns and cities.
It has 10 principles to inspire and inform the layout of cities, towns, villages, neighbourhoods, buildings, streets and open spaces, to create more opportunities for physical activity.
Find out more about our Uniting the Movement strategy
What we know
- 37% of adults aged 16+ travel actively at least twice a month
- Walking for travel is the second most common physical activity in England – done by 33% of people at least twice a month
- Cycling for travel is seventh – done by 6.8% of people
- 37% of children aged 5-15 walk for travel at least once a week, and 10% cycle for travel
- Among the ‘active’ population, 11% are dependent on walking for travel and 1.3% on cycling for travel, to achieve their 150+ minutes of physical activity.

Sustrans on Active Travel
Carried out by an independent team led by walking and cycling charity Sustrans , in partnership with Dr Nick Cavill and Professor Adrian Davis, their research examines the effect active travel has on overall physical activity levels and reviews the effectiveness of many types of active travel interventions at increasing walking, cycling or physical activity.
The research looked at short journeys, like walking to the shops, walking the kids to school, cycling to work, or cycling to the station to catch a train.
There’s strong evidence that implementing active travel principles are effective at increasing walking, cycling and physical activity, particularly for town or citywide approaches, typically made up of several interventions working together across a whole place.
Overall, the Sustrans review concludes that interventions increase active travel and therefore levels of physical activity. Of the different typologies, the evidence was strongest (in terms of volume and robustness) when active travel was encouraged in cities or towns, while each of the other intervention types reported some increases in walking and/or cycling.
Data from leading surveys show the significant contribution active travel already makes to the overall physical activity levels of children and adults.
There's a clear consensus that active travel can make an even greater contribution to physical activity – through increasing both the amount and intensity of activity. This evidence review gives the platform for a direct and coordinated effort to realise this untapped potential.
Active Travel Uptake and Physical Activity
Active Travel Uptake and Physical Activity explores the relationship between physical activity and active travel behaviour, using data from the People and Places Survey (which is used by Transport for London to evaluate their Mini-Holland scheme).
It reveals how active travel can be effective at helping inactive people become active, and how increasing active travel can increase overall physical activity too.
Variation in Active Travel and the Scope to Increase Participation
Variation in Active Travel and the Scope to Increase Participation analyses two major datasets to assess the variation in, and scope to, increase active travel. It includes two scenarios showing the impact if everywhere had London’s short walking rates, or Cambridge’s cycling rates. Effective interventions and collaboration across the sector could help us realise this unmet potential.
Active Travel Full Report – Evidence Review
Active Travel Full Report – Evidence Review provides an in-depth account of the research methodology (including study limitations), findings and conclusions drawn from Sustrans' study, as well as context and contributions relevant to the study. Literature is also included which covers a control mechanism to support comparison between the intervention and non-intervention locations.
Active Travel Summary – Evidence Review
Active Travel Summary – Evidence Review provides an authoritative account of how, and how best, active travel can support physical activity. It provides the main findings and messages, gives examples of effective interventions and tells you how you can use the full report to deliver, fund and research active travel to support physical activity.
Related content

The outdoors presents a huge opportunity to encourage people to get active. But to grow the outdoors activity market, there are some key trends to consider.

The design of where we live and work plays a vital role in keeping us active.

Our Active Lives surveys measure the physical activity levels of adults and children and young people across England, providing a wealth of data.
Sign up to our newsletter
You can find out exactly how we'll look after your personal data , but rest assured we’ll only use it to make sure you receive our newsletter, to understand how you interact with our newsletter, and to provide administrative information about our newsletter.
Your registration has been completed successfully.
We could not complete your registration, please try again later.

An official website of the United States government
The .gov means it's official. Federal government websites often end in .gov or .mil. Before sharing sensitive information, make sure you're on a federal government site.
The site is secure. The https:// ensures that you are connecting to the official website and that any information you provide is encrypted and transmitted securely.
- Publications
- Account settings
- Browse Titles
NCBI Bookshelf. A service of the National Library of Medicine, National Institutes of Health.
Green J, Steinbach R, Jones A, et al. On the buses: a mixed-method evaluation of the impact of free bus travel for young people on the public health. Southampton (UK): NIHR Journals Library; 2014 Feb. (Public Health Research, No. 2.1.)

On the buses: a mixed-method evaluation of the impact of free bus travel for young people on the public health.
Appendix 8 systematic review of health benefits of active travel (extract).
This is an extract from a paper published as Saunders L, Green J, Petticrew M, Steinbach R, Roberts H. What are the health benefits of active travel? A systematic review of trials and cohort studies. PLOS One 2013; 8 :e69912.
- What are the health benefits of active travel? A systematic review
Lucinda E Saunders, Judith M Green, Mark P Petticrew, Rebecca Steinbach, Helen Roberts
Background: Increasing the proportion of active travel (primarily walking and cycling) within the population has been widely advocated as a route to reducing obesity levels and achieving other population health benefits. However, the strength of evidence underpinning these assumptions is not known. The objective of this study was to assess the evidence that active travel has significant health benefits.
Methods: The study design was a systematic review of (i) non-randomised and randomised trials, and (ii) observational studies examining either (i) the effects of interventions to promote active travel or (ii) the association between active travel and health outcomes. The data sources were published and unpublished reports of studies in any language identified by searching 11 electronic databases, websites, reference lists and papers identified by experts in the field. The eligibility criteria were prospective observational and intervention studies measuring any health outcome of active travel in the general population were included. Studies of patient groups were excluded.
Results: Twenty-two studies from 11 countries were included, of which six were studies conducted in children. Six studies evaluated active travel interventions. Sixteen were prospective cohort studies which did not evaluate the impact of a specific intervention. No studies were identified with obesity as an outcome in adults; three prospective cohort studies in children found no association between obesity and active travel. Small positive effects on other health outcomes were found for active travel in six intervention studies, but these studies were all at risk of selection bias; modest benefits for other health outcomes were identified in 13 prospective studies.
Conclusions: However there is accumulating evidence that active travel may have positive effects on other health outcomes than obesity. Further trials of interventions to increase active travel are needed to assess its impacts on obesity and other health outcomes.
Keywords: Public health; systematic review; active transport; physical activity
The link between physical activity and health has long been known, with the scientific link established in Jerry Morris’ seminal study of London bus drivers in the 1950’s [ 1 ]. There is also good ecological evidence that obesity rates are increasing in countries and settings in which ‘active travel’ (primarily walking and cycling for the purpose of functional rather than leisure travel) is declining [ 2 – 3 ]. Given that transport is a necessity of everyday life, whereas leisure exercise such as going to a gym may be an additional burden for individuals, and is difficult to sustain long term, [ 4 – 5 ] encouraging ‘active travel’ may be a feasible approach to increasing levels of physical activity [ 6 ]. It is also plausible to assume that interventions aimed at increasing the amount of active travel within a population are likely to have a positive impact on health. This has been the underlying rationale for recent public health interest in transport interventions aiming to address the obesity epidemic and a range of other health and social problems [ 7 ]. In July 2011 the Chief Medical Officers for the UK produced new guidance for physical activity ‘Start Active, Stay Active [ 8 ]’ which re-emphasised the known risks to health of the sedentary behaviour of the UK population and the central role of active travel: “For most people, the easiest and most acceptable forms of physical activity are those that can be incorporated into everyday life. Examples include walking or cycling instead of travelling by car, bus or train.” (p17). Active travel is seen by policy makers and practitioners as not only an important part of the solution to the problem of obesity but also for a range of other health issues at a population level. It may also have other important non-health outcomes, including a reduction in traffic congestion and carbon emissions [ 9 ].
It has recently been recommended that the public health community should advocate for effective policies that reduce car use and increase active travel [ 10 ]. One recent overview concluded that active travel policies have the potential to generate large population health benefits through increasing population physical activity levels, and smaller health benefits through reductions in exposures to air pollution in the general population. However, while a recent systematic review and meta-analysis [ 11 ] found that non-vigorous physical activity reduced all-cause mortality, the two studies which looked at active commuting alone [ 12 – 13 ] found no evidence of a positive effect. There are a number of reasons why active travel may not contribute to overall physical activity levels. Studies of young children have found no differences in overall physical activity levels for active and non-active commuters [ 14 – 16 ], perhaps because the distance walked to school may simply be too short to make a significant contribution. For both children and adults, it is unclear how far individuals may offset the extra effort of cycling or walking with additional food intake, or by reducing physical activity in other areas of everyday life. Additionally, there is evidence that the health benefits of exercise are not shared equally across populations, with the cultural and psychological meanings of activities such as walking or cycling potentially influencing their physiological effects [ 17 – 18 ].
A reliable overview of the strength of the scientific evidence will therefore be of value, because the causal pathways between active travel and health outcomes such as obesity are likely to be complex, and promoting active travel may have unintended adverse consequences [ 19 ].
Overall, aside from impacts on all-cause mortality, the evidence that active travel will lead to a range of other health and social benefits including a reduction in obesity remains to be determined, and existing studies show a mixed picture on the relationship between active travel and health outcomes including obesity [ 20 ]. Recent systematic reviews have focussed almost exclusively on cross-sectional studies [ 20 – 22 ], or one narrow health outcome [ 23 ] or combined leisure and transport activity [ 24 ]. A clear picture of the health effects of active travel cannot be obtained from these reviews so a systematic review of evidence from empirical studies was carried out with the objective of assessing the health effects of active travel specifically (rather than of physical activity in general, where the evidence is already well-established). It synthesises the relevant empirical evidence from intervention studies and cohort studies in which health outcomes of active travel have been purposively or opportunistically measured. Obesity is a particular focus of this review because the rise in the prevalence of obesity over the past 30–40 years has been in tandem with the decline of active travel and overweight and obesity are now the fifth leading risk for death globally as well as being responsible for significant proportions of the disease burden of diabetes (44%), ischaemic heart disease (23%) and some cancers (7–41%) [ 25 ].
A systematic review was undertaken to identify and synthesise the evidence for the impact on obesity and other health outcomes of active travel (Review protocol and full search strategy is available on request from the authors). Eleven databases were searched for prospective studies of any design ( Table 1 ) (this search will be updated if the paper is accepted). The search strategy adapted the search terms developed by Hoskings et al. [ 26 ] (2010 Cochrane Review) and Bunn et al. [ 27 ] (2003). Hand-searching of relevant studies was also conducted, and bibliographies of identified papers were checked along with those of papers already known to the researchers. No time, topic or language exclusions or limits were applied.
The search strategy was conducted on the following databases
Two reviewers independently identified potentially relevant prospective studies. If it was not clear from the title and abstract whether the article was relevant to active travel then the paper was reviewed in detail. Papers which were not published in English would have been translated in full if deemed potentially eligible for inclusion. One reviewer [LS] then screened the articles using the following inclusion criteria:
- Prospective study examining relationship between active travel and health outcomes; or study evaluating the effect of an active travel intervention;
- Active travel (walking or cycling for transport rather than work or leisure) measured in a healthy population (e.g. using self report measures, or use of pedometers); and
- Health outcome included.
Retrospective and single cross-sectional studies (e.g. one-off survey) were excluded.
One reviewer (LS) extracted data according to a common table format including information on methods, outcomes (as adjusted relative risks, or hazard ratios; if these were not available or calculable, other effect measures were extracted – e.g. mean changes), populations and setting for each study, and two reviewers then independently reviewed each study using the ‘Effective Public Health Practice Project Quality Assessment Tool’ [ 28 ] and discussed differences to produce consensus scores for each study against each quality criterion. A narrative review, taking account of study quality, was then carried out. It was not possible to conduct a meta-analysis as meta-analysis of mixed designs – and particularly observational studies – is not robust and this review includes a range of mainly observational study designs, populations and outcomes [ 29 ].
Twenty-two studies reported in twenty-seven papers were included (see Tables 2 and 3 ). Three were prospective cohort studies with obesity-related outcomes; thirteen were prospective cohort studies with other health outcomes; and six were intervention studies with other health outcomes (see PRISMA diagram for details of excluded studies - further details available on request from the authors). For the prospective cohort studies the results are presented adjusted for covariates, there was variation in what adjustments were made by different studies but the adjustments did not have large impacts on effect size. Details of the methodological assessment of each paper are reported in a separate web table.
Active travel and obesity
Three prospective cohort studies with obesity outcomes were identified, all of which were conducted in North America and included children aged 10 years or younger at baseline who were followed up for between 6 months and two years [ 30 – 32 ]. BMI measurements were taken in all three studies and skinfold measurements were taken in two of the studies. There was no significant association between active travel and the obesity outcome measures in any of the studies. All three papers scored low on the quality assessment measure as no data on baseline differences between groups were presented.
Active travel and other health outcomes
1. intervention studies.
Six intervention studies measured health outcomes of active travel other than obesity. Results were mixed; three studies found improvements in fitness measures in the intervention group compared with the control group [ 33 – 36 ], two found increased physical activity levels [ 37 – 39 ] but one did not [ 35 – 36 ], two found no significant change in body weight [ 35 – 38 ] and one found significantly higher scores for 3 of the 8 domains of the SF-36 in the intervention group. All these studies were at risk of selection bias and none reported baseline differences between intervention and control groups for potential confounders [ 33 – 40 ]. However, all six studies scored moderately overall. All but one [ 33 ] were controlled with appropriate statistical analyses. All but one [ 40 ] had low levels of drop-out and ensured that the intervention was consistently applied. Five studied adults in north-west Europe and measured multiple health outcomes including fitness, blood pressure, cholesterol, oxygen uptake, and body weight [ 33 – 38 , 40 ]. One study involving children in the USA measured moderate-to-vigorous physical activity (MVPA) in a randomised controlled trial however, there were only 12 participants and a two week duration [ 39 ].
2. Prospective cohort studies
Thirteen prospective cohort studies (described below) were identified [ 12 – 13 , 41 – 55 ], 8 of which were conducted in Scandinavia [ 12 , 41 – 43 , 45 – 50 ], possibly reflecting the longer history of higher population levels of active travel as a result of which questions on active travel have been included in population surveys over recent decades. Overall, these studies showed conflicting findings when measuring similar mortality and cardiovascular outcomes and of the four studies which measured outcomes not measured by other studies two found significant effects [ 43 , 46 ], one found a non-significant effect and one found no effect [ 49 ].
All cause mortality
One study in Denmark found a significantly lower all-cause risk of mortality in cycle-commuters compared with non-cyclists – this was not found in a second such study in Finland [ 12 ]. Batty et al. (2001) [ 13 ] also found no statistically significant differences for 12 mortality endpoints between men in London, UK who actively travelled more or less than 20 minutes on their journey to work. Matthews et al. (2007) [ 51 ] studied women in China and found no significant relationship between walking and cycling for transport and all cause mortality [ 51 ]. Besson et al. (2008) [ 55 ] studied men and women in Norfolk, UK and found a non-significant reduced risk of all cause mortality in those who travelled actively (measured as > 8 metabolic equivalent task values (MET.h.wk -1 )).
Cardiovascular Outcomes
Besson et al. found no significant reduction in cardiovascular mortality risk among active travellers whereas Barengo (2004) [ 12 ] in Finland found it to be significantly lower (Adjusted hazard ratio 0.78 [CI: 0.62–0.97]) only among women actively travelling 15–29 minutes each way to work compared with those travelling less than 15 minutes each way but not in those travelling more than 30 minutes each way, and not in men. Hu et al. (2005, 2007, 2007) [ 45 , 47 – 48 ], also measured CHD and found a significant relationship in women who travelled 30+ minutes per day (0.80 [CI:0.69–0.92]) compared with those who did not travel actively at all. Like Barengo (2004) [ 12 ], they found no relationship between active travel and CHD in men. Barengo (2005) [ 42 ] found no difference in hypertension risk between those travelling more or less than 15 minutes each way to work. Hayashi et al. (1999) [ 44 ] found a statistically significant reduced risk of hypertension in those men in Osaka, Japan who walked 21+ minutes to work compared with men who walked less than 10 minutes (adjusted relative risk 0.70 [CI: 0.59–0.95]). However it was not clear from the paper how frequently the active travellers walked to work. Wagner et al. (2001, 2002, 2003) [ 52 – 54 ] found a non-significant increase in risk of CHD events in men walking and cycling to work, although the amount of exercise taken while actively commuting was not recorded.
Other Health Outcomes
Four studies in Scandinavia examined other health outcomes. A study in Finland found the relative risk for Type 2 diabetes to be 34% lower among active travellers travelling 30+ minutes per day compared with those not travelling actively (CI: 0.45–0.92). Luoto et al. 2000 [ 50 ], also in Finland, reported a non-significant reduction in relative breast cancer risk at 15 years follow-up of 0.87 (CI: 0.62–1.24) in women who actively travelled more than 30 minutes each day. Cooper et al. (2008) [ 43 ] followed school children in Odense, Denmark for 6 years from age 9 and measured cardio-respiratory fitness. Cycling to school was associated with higher levels of cardio-respiratory fitness, as was taking up cycling. Lofgren et al. (2010) [ 49 ] also studied children actively travelling to school in Malmo, Sweden and measured a range of bone health indicators but found no significant relationship.
This review found no prospective studies of active travel with obesity as a primary outcome in adults, and no significant associations between obesity and active travel were found in the studies of children. For other health outcomes small positive health effects were found in groups who actively travelled longer distances including reductions in risk of all cause mortality [ 41 ], hypertension [ 44 ], and Type 2 diabetes [ 46 ].
The evidence is difficult to synthesise as active travel is not defined consistently across studies, and the definition is dependent on what is considered normal in a particular setting. For example Luoto (2000), and Barengo (2004, 2005) [ 12 , 42 ] considered active travel to be more than 30 minutes per day and inactive travel to be less than 30 minutes per day. Batty (2001) and Hayashi (1999) [ 44 ] however considered active travel to be more than 20 minutes per day. Differences in health outcomes between people who actively travel 29 minutes per day and those who travel 31 minutes per day are unlikely, so differences between active and sedentary populations may be masked by the methods by which active travel is defined and reported. Meanwhile Besson (2008) [ 55 ] considered active travel to be >8 metabolic equivalent task (MET) hours per week while Matthews (2007) [ 51 ] considered it to be > 3.5 metabolic equivalent task hours per day which may reflect differences in norms between Norfolk and Shanghai in terms of active travel.
It is difficult to generalise from studies conducted in different countries or settings, as the amount of exertion required to travel actively may be greater in some settings than others with the same journey time, due to differences in congestion, terrain, and weather conditions. In the UK only 39% of men and 29% of women achieve 30 minutes of moderate intensity physical activity of any type five times a week so a population change of adding 30 minutes of active travel per day might well produce much larger changes in health outcomes than were measured in non-UK studies. For example in Barengo (2005) [ 43 ] 30% of men and 46% of women travelled actively more than 15 minutes each way to work which shows a higher level of active travel in the population than may be seen in other countries, including the UK. The prospective cohort studies also tended to focus on travel to work or school rather than active travel for general transportation, which again may limit generalisability.
The study by Cooper et al. (2008) of school children in Odense, Denmark found that 65% of boys and girls walked or cycled to school, a much higher proportion than would currently be found in the UK. However, journey times were less than 15 minutes for the majority of active travellers so the health effects of active travel for such short periods are difficult to measure in isolation. This highlights one of the difficulties of assuming active travel to school in young people to be a major source of physical activity, as it is common for children only to walk or cycle to school when the journey time is relatively short. While in adults bouts of as little as 10 minutes of physical activity are acceptable to contribute to their weekly physical activity target of minimum 150 minutes, children aged 5–18 are expected to be physically active for a minimum of 420 minutes per week [ 8 ] so a short active commute to school will not make a significant contribution to their overall physical activity requirements. The study by Lofgren et al. [ 49 ] included a study population with fairly high levels of physical activity overall and half the participants were active travellers which makes it difficult to attribute health outcomes to active travel alone when active travel may not contribute significantly to participants overall physical activity levels.
De Geus et al. (2007) [ 33 ] highlighted one of the difficulties of measuring active travel in intervention studies as they found that study participants cycled 13% faster when their fitness was being measured compared to their usual speed on their daily cycle commute. Hence just through the process of measuring active travel there is the risk of over-estimating the health benefits it can confer. Thus issues including terrain, problems of definition, study design and the difficulty of disentangling the effects of active travel from more general physical activity make synthesis difficult. It is in this context that a wider range of studies, including ethnographic and qualitative work, to inform generalisable theory may be helpful. Active travel not only potentially benefits health as a source of physical activity but may also off-set air pollution from motorised vehicles for those journeys and contribute to social and environmental goals such as improving social cohesion and reducing CO 2 emissions. These combined benefits may be a potent argument for promoting active travel, and emphasise the importance of models which incorporate both health and non-health benefits [ 57 – 58 ].
Finally, reviewing this evidence is challenging, in particular designing searches which are both sensitive and specific, and over 70% of the studies identified for this search were found through hand-searching, despite a thorough search of databases. While it is possible that studies may have been missed, our comprehensive search for studies makes it unlikely that a significant body of work has been excluded.
- Conclusions
This is the first study to bring together all prospective observational and intervention studies to give an overview of the health effects of active travel in general. Previous systematic reviews of health outcomes of active travel have included primarily cross-sectional studies from which reliable inferences about causality cannot easily be drawn, or have relied on indirect evidence on the effects of physical activity on health, as opposed to the effects of active travel.
The interest in identifying health outcomes of active travel is to determine whether active travel affects health. However this will depend on the context within which individuals are travelling – length of journey, frequency of travel, nature of the terrain, risk of injury, levels of air pollution and so on as well as other aspects of the lifestyles of the participants. For example travelling actively may mean that the individual is more or less likely to be physically active at other times, or they may modify their diet. It may mean that they are more or less likely to strengthen social networks. While the studies identified in this review do not enable us to draw strong conclusions about the health effects of active travel, there is consistent support for the positive effects on health of active travel over longer periods and perhaps distances.
This review highlights the difficulty in measuring health outcomes of active travel in the general population. In prospective cohort studies if the follow-up period is short then it may not be possible to measure health effects that take many years to appear, such as changes in risk of heart disease. Conversely in those studies which have long follow-up periods of many years there is the risk that active travel has not been consistently adhered to throughout the follow-up period.
These cautious conclusions on the health impact of active travel do not, of course, mean that now is the time to confine active travel to the walk from the front door to the car door. The evidence on the effect of physical activity is sufficiently strong to suggest that the part played by active travel in improving health is likely to be significant and is well worth maintaining. Other aspects of active travel, including a reduction in pollution, and in carbon footprint are clear potential co-benefits and likely to become even more so.
- Appendices:
PRISMA flowchart
Table 2 – results [available from authors]
Table 3 – summary of outcomes [available from authors]
Search strategy
Quality assessment table [available from authors]
Ethics approval and patients’ consent, funding sources and independence:
Ethical approval was not required as this is a systematic review. This project was funded by the National Institute for Health Research Public Health Research programme (project number 09/3001/13). The views and opinions expressed herein are those of the authors and do not necessarily reflect those of the Department of Health. The funders had no role in the design, conduct or reporting of project findings.
- Search Strategy
Final Search Strategy for Medline
Search in ‘keyword’
- (Walk* or cycle* or cycli* or bicycle* or bike* or walking bus* or ecological commut* or ecological transport* or non-auto* or non-motori?e*).mp.
- (green* adj3 (travel* or transport* or commut*)).mp.
- ((activ* or health*) adj3 (travel* or transport* or commut*)).mp.
- (ecological adj3 (travel* or transport* or commut*)).mp.
- (Prospective adj1 (study or studies)).mp
- (Program evaluation or evaluation research).mp.
- (randomi$ or randomly).mp.
- (controlled adj2 (trial or trials or study or studies or experiment$)).mp
- (before adj1 after).ab,ti.
- (control adj1 group$).ab,ti.
- (intervention adj1 group$).ab,ti.
- (experimental adj1 group$).ab,ti.
- (comparison adj1 group$)ab,ti.
- (Body mass index or BMI or body mass gain or overweight or weight gain or weight status or weight management or weight loss or body weight or waist circumference or obesity or calorie* or energy)
- 5 and 15 and 16
- 17 in humans
FIGURE A8.1
PRISMA flow diagram.
Included under terms of UK Non-commercial Government License .
- Cite this Page Green J, Steinbach R, Jones A, et al. On the buses: a mixed-method evaluation of the impact of free bus travel for young people on the public health. Southampton (UK): NIHR Journals Library; 2014 Feb. (Public Health Research, No. 2.1.) Appendix 8, Systematic review of health benefits of active travel (extract)
- PDF version of this title (2.8M)
In this Page
- Ethics approval and patients’ consent, funding sources and independence:
Other titles in this collection
- Public Health Research
Related information
- PMC PubMed Central citations
- PubMed Links to PubMed
Recent Activity
- Systematic review of health benefits of active travel (extract) - On the buses: ... Systematic review of health benefits of active travel (extract) - On the buses: a mixed-method evaluation of the impact of free bus travel for young people on the public health
Your browsing activity is empty.
Activity recording is turned off.
Turn recording back on
Connect with NLM
National Library of Medicine 8600 Rockville Pike Bethesda, MD 20894
Web Policies FOIA HHS Vulnerability Disclosure
Help Accessibility Careers
Policies to Promote Active Travel: Evidence from Reviews of the Literature
- Built Environment and Health (MJ Nieuwenhuijsen and AJ de Nazelle, Section Editors)
- Published: 10 July 2017
- Volume 4 , pages 278–285, ( 2017 )
Cite this article

- Meghan Winters 1 ,
- Ralph Buehler 2 &
- Thomas Götschi 3
5042 Accesses
103 Citations
24 Altmetric
Explore all metrics
Purpose of review
While many levels of government recognize that walking and cycling (active travel) are critical to healthy cities, a continued challenge is to identify and prioritize strategies that will increase walking and cycling for transportation. We review evidence on policies that can increase active travel.
Recent findings
The reviews included here conclude that policies related to active travel may operate at various levels of the socio-ecological framework, including society, cities, routes or individuals. The provision of convenient, safe and connected walking and cycling infrastructure is at the core of promoting active travel, but policies may work best when implemented in comprehensive packages.
There is strong evidence that active travel can result in substantial health benefits. However, there remains considerable uncertainty about the exact effects of specific policies on walking or cycling rates or safety. Further research is needed to quantify the impact of specific policies or packages of policies, especially across different settings or for different population segments.
This is a preview of subscription content, log in via an institution to check access.
Access this article
Price includes VAT (Russian Federation)
Instant access to the full article PDF.
Rent this article via DeepDyve
Institutional subscriptions
Assessing the role of urban green spaces for human well-being: a systematic review

Understanding the Relationship between Urban Public Space and Social Cohesion: A Systematic Review
Urban sprawl, public transport, and increasing co2 emissions: the case of metro manila, philippines, papers of particular interest, published recently, have been highlighted as: • of importance •• of major importance.
Physical Activity Guidelines Advisory Committee. Physical activity guidelines advisory committee report, 2008. Washington, DC; 2008.
Kelly P, Kahlmeier S, Götschi T, Orsini N, Richards J, Roberts N, et al. Systematic review and meta-analysis of reduction in all-cause mortality from walking and cycling and shape of dose response relationship. Int J Behav Nutr Phys Act. 2014;11:132.
Article PubMed PubMed Central Google Scholar
Oja P, Titze S, Bauman A, de Geus B, Krenn P, Reger-Nash B, et al. Health benefits of cycling: a systematic review. Scand J Med Sci Sports. 2011;21:496–509.
Article PubMed CAS Google Scholar
Saunders LE, Green JM, Petticrew MP, Steinbach R, Roberts H. What are the health benefits of active travel? A systematic review of trials and cohort studies. PLoS One. 2013;8:e69912.
Article PubMed PubMed Central CAS Google Scholar
Woodcock J, Franco OH, Orsini N, Roberts I. Non-vigorous physical activity and all-cause mortality: systematic review and meta-analysis of cohort studies. Int J Epidemiol. 2011;40:121–38.
Article PubMed Google Scholar
Hamer M, Chida Y. Active commuting and cardiovascular risk: a meta-analytic review. Prev Med (Baltim). 2008;46:9–13.
Article Google Scholar
Hamer M, Chida Y. Walking and primary prevention: a meta-analysis of prospective cohort studies. Br J Sports Med. 2008;42:238–43.
Doorley R, Pakrashi V, Ghosh B. Quantifying the health impacts of active travel: assessment of methodologies. Transp Rev. 2015;35:559–82.
• Mueller N, Rojas-Rueda D, Cole-Hunter T, de Nazelle A, Dons E, Gerike R, et al. Health impact assessment of active transportation: a systematic review. Prev Med (Baltim). 2015;76:103–14. This study provides a systematic review of health impacts of active travel policies
Teschke K, Reynolds CCO, Ries FJ, Gouge B, Winters M. Bicycling: health risk or benefit? UBC Med J. 2012;3:6–11.
Google Scholar
FHWA. Our nation’s travel. Analysis of the 2009 NHTS. Washington, DC; 2010.
Statistics Canada. 2011 National Household Survey. In: Stat. Canada Cat. no. 99–012-X2011064. 2013. http://www12.statcan.gc.ca/census-recensement/2011/dp-pd/index-eng.cfm . Accessed 27 Feb 2017.
Bassett DR, Pucher J Jr, Buehler R, Thompson DL, Crouter SE. Walking, cycling, and obesity rates in Europe, North America, and Australia. J Phys Act Health. 2008;5:795–814.
Buehler R, Pucher J, Merom D, Bauman A. Active travel in Germany and the U.S.: contributions of daily walking and cycling to physical activity. Am J Prev Med. 2011;41:241–50.
•• Handy S, Van Wee B, Kroesen M. Promoting cycling for transport: research needs and challenges. Transp Rev. 2014;34:4–24. This review provides outlines the key questions facing bicycling research, and provides guidance to address the research needs
Hiatt R. An alternative to auto LOS for transportation impact analysis. Transp. Res. Board 85th Annu. Meet. 2006.
Shoup DC. The high cost of free parking. Updated ed. Chicago, IL: Planners Press, American Planning Association; 2011.
FHWA. Funding for highways and disposition of highway-user revenues, all units of government, 2012, Table HF 10. Federal Highway Association, US Dep. Transp. 2014.
Buehler R, Gotschi T, Winters M. Moving toward active transportation: how policies can encourage walking and bicycling. Active Living Research Brief. Released January 2016. http://activelivingresearch.org/ActiveTravelreview .
Krizek K, Forsyth A, Baum L. Walking and cycling international literature review. Victoria Dep. Transp. Melbourne, Aust; 2009.
Sallis J, Cervero R, Ascher W, Henderson K, Kraft M, Kerr J. An ecological approach to creating active living communities. Annu Rev Public Health. 2006;27:297–322.
Ewing R, Cervero R. Travel and the built environment: a meta-analysis. J Am Plan Assoc. 2010;76:265–94.
Larouche R. Built environment features that promote cycling in school-aged children. Curr Obes Rep. 2015;4:494–503.
Pucher J, Dill J, Handy S. Infrastructure, programs, and policies to increase bicycling: an international review. Prev Med. 2010;50:S106–25.
•• Buehler R, Dill J. Bikeway networks: a review of effects on cycling. Transp Rev. 2015;1647:1–19. Reviews evidence on the connection between cycling levels and different types of bikeway infrastructure—ranging from cycling in the road with traffic to separated bike paths
Fraser SDS, Lock K. Cycling for transport and public health: a systematic review of the effect of the environment on cycling. Eur J Pub Health. 2011;21:738–43.
Galvez MP, Pearl M, Yen IH. Childhood obesity and the built environment. Curr Opin Pediatr. 2010;22:202–7.
Heath GW, Brownson RC, Kruger J, Miles R, Powell KE, Ramsey LT. The effectiveness of urban design and land use and transport policies and practices to increase physical activity: a systematic review. J Phys Act Health. 2006;3:S55–76.
Larouche R, Saunders TJ, John Faulkner GE, Colley R, Tremblay M. Associations between active school transport and physical activity, body composition, and cardiovascular fitness: a systematic review of 68 studies. J Phys Act Health. 2014;11:206–27.
Macmillan AK, Hosking J, Connor JL, Bullen C, Ameratunga S. A Cochrane systematic review of the effectiveness of organisational travel plans: improving the evidence base for transport decisions. Transp Policy. 2013;29:249–56.
Hosking J, Macmillan A, Connor J, Bullen C, Ameratunga S. Organisational travel plans for improving health. Cochrane Database Syst Rev. 2010;3:CD005575.
Martin A, Suhrcke M, Ogilvie D. Financial incentives to promote active travel: an evidence review and economic framework. Am J Prev Med. 2012;43:e45–57.
Ogilvie D. Promoting walking and cycling as an alternative to using cars: systematic review. BMJ. 2004;329:763.
Ogilvie D, Foster CE, Rothnie H, Cavill N, Hamilton V, Fitzsimons CF, et al. Interventions to promote walking: systematic review. BMJ. 2007;334:–1204.
Rissel C, Curac N, Greenaway M, Bauman A. Physical activity associated with public transport use—a review and modelling of potential benefits. Int J Environ Res Public Health. 2012;9:2454–78.
Scheepers CE, Wendel-Vos GCW, den Broeder JM, van Kempen E, van Wesemael PJV, Schuit AJ. Shifting from car to active transport: a systematic review of the effectiveness of interventions. Transp Res Part A Policy Pract. 2014;70:264–80.
Yang L, Sahlqvist S, McMinn A, Griffin SJ, Ogilvie D. Interventions to promote cycling: systematic review. BMJ. 2010;341:c5293.
Cui Y, Mishra S, Welch TF. Land use effects on bicycle ridership: a framework for state planning agencies. J Transp Geogr. 2014;41:220–8.
Meddin R, DeMaio P. The bike-sharing world map. 2016. http://www.bikesharingmap.com/ . Accessed 27 Feb 2017.
Shaheen S, Martin E, Cohen A, Finson R. Public bikesharing in North America: early operator and user understanding. 2012.
Hamre A, Buehler R. Commuter mode choice and free car parking, public transportation benefits, showers/lockers, and bike parking at work: evidence from the Washington, DC Region. J Public Transp. 2014;17:67–91.
Hansen AY, Umstattd Meyer MR, Lenardson JD, Hartley D. Built environments and active living in rural and remote areas: a review of the literature. Curr Obes Rep. 2015;4:484–93.
Pucher J, Buehler R, Seinen M. Bicycling renaissance in North America? An update and re-appraisal of cycling trends and policies. Transp Res Part A Policy Pract. 2011;45:451–75.
Gase LN, Barragan NC, Simon PA, Jackson RJ, Kuo T. Public awareness of and support for infrastructure changes designed to increase walking and biking in Los Angeles County. Prev Med (Baltim). 2015;72:70–5.
Alliance for Biking & Walking. Bicycling and walking in the United States: 2016 benchmarking report; 2016.
Elvik R. The non-linearity of risk and the promotion of environmentally sustainable transport. Accid Anal Prev. 2009;41:849–55.
Jacobsen P. Safety in numbers: more walkers and bicyclists, safer walking and bicycling. Inj Prev. 2003;9:205–9.
Jacobsen PL, Ragland DR, Komanoff C. Safety in numbers for walkers and bicyclists: exploring the mechanisms. Inj Prev. 2015;21:217–20.
•• Götschi T, Garrard J, Giles-Corti B. Cycling as a part of daily life: a review of health perspectives. Transp Rev. 2016;36:45–71. This study reviews the most relevant links between cycling and health and presents research approaches and needs, many of which apply equally to walking
Cavill N, Muller L, Mulhall C, Harold K, Kennedy A, Hillsdon M, et al. Cycling demonstration towns: surveys of cycling and physical activity 2006 to 2009. London, Engl Cycl Engl. 2009.
Litman T. Quantifying the benefits of nonmotorized transportation for achieving mobility management objectives. Transp Res Rec. 2004;1441:134–40.
Sallis J, Spoon C, Cavill N, et al. Co-benefits of designing communities for active living: an exploration of literature. Int J Behav Nutr Phys Act. 2015;12:30.
Brown V, Diomedi BZ, Moodie M, Veerman JL, Carter R. A systematic review of economic analyses of active transport interventions that include physical activity benefits. Transp Policy. 2016;45:190–208.
Ogilvie D, Bull F, Cooper A, et al. Evaluating the travel, physical activity and carbon impacts of a ‘natural experiment’ in the provision of new walking and cycling infrastructure: methods for the core module of the iConnect study. BMJ Open. 2012;2:e000694.
Mayne SL, Auchincloss AH, Michael YL. Impact of policy and built environment changes on obesity-related outcomes: a systematic review of naturally occurring experiments. Obes Rev. 2015;16:362–75.
Download references
Acknowledgments
This manuscript is based on a research brief prepared by the authors for Active Living Research, with funding from the Robert Wood Johnson Foundation. We would like to acknowledge Prabhu Ponkshe, Jim Sallis, David R. Bassett, Jr., Sean Co, Ruth L. Steiner and other Robert Wood Johnson staff for their valuable feedback and contributions as part of the research brief. We also acknowledge Kyle Lukacs for his help collecting and organizing the literature and thank the Metropolitan Institute at Virginia Tech for financially supporting Lukacs’ work. We also acknowledge Moreno Zanotto for assistance with manuscript preparation.
Author information
Authors and affiliations.
Faculty of Health Sciences, Simon Fraser University, Blusson Hall Rm 11522, 8888 University Drive, Burnaby, B.C., V5A 1S6, Canada
Meghan Winters
School of Public and International Affairs, Virginia Tech, 1021 Prince Street, Suite 200, Alexandria, VA, 22301, USA
Ralph Buehler
Epidemiology, Biostatistics and Prevention Institute, University of Zurich, Hirschengraben 84, CH-8001, Zurich, Switzerland
Thomas Götschi
You can also search for this author in PubMed Google Scholar
Corresponding author
Correspondence to Meghan Winters .
Ethics declarations
Conflict of interest.
Meghan Winters, Thomas Götschi and Ralph Buehler declare that they have no conflict of interest.
Human and Animal Rights and Informed Consent
This article does not contain any studies with human or animal subjects performed by any of the authors.
Additional information
This article is part of the Topical Collection on Built Environment and Health
Rights and permissions
Reprints and permissions
About this article
Winters, M., Buehler, R. & Götschi, T. Policies to Promote Active Travel: Evidence from Reviews of the Literature. Curr Envir Health Rpt 4 , 278–285 (2017). https://doi.org/10.1007/s40572-017-0148-x
Download citation
Published : 10 July 2017
Issue Date : September 2017
DOI : https://doi.org/10.1007/s40572-017-0148-x
Share this article
Anyone you share the following link with will be able to read this content:
Sorry, a shareable link is not currently available for this article.
Provided by the Springer Nature SharedIt content-sharing initiative
- Active travel
Advertisement
- Find a journal
- Publish with us
- Track your research
What are the health benefits of active travel? A systematic review of trials and cohort studies
Affiliation.
- 1 Faculty of Public Health and Policy, London School of Hygiene and Tropical Medicine, London, United Kingdom.
- PMID: 23967064
- PMCID: PMC3744525
- DOI: 10.1371/journal.pone.0069912
Background: Increasing active travel (primarily walking and cycling) has been widely advocated for reducing obesity levels and achieving other population health benefits. However, the strength of evidence underpinning this strategy is unclear. This study aimed to assess the evidence that active travel has significant health benefits.
Methods: The study design was a systematic review of (i) non-randomised and randomised controlled trials, and (ii) prospective observational studies examining either (a) the effects of interventions to promote active travel or (b) the association between active travel and health outcomes. Reports of studies were identified by searching 11 electronic databases, websites, reference lists and papers identified by experts in the field. Prospective observational and intervention studies measuring any health outcome of active travel in the general population were included. Studies of patient groups were excluded.
Results: Twenty-four studies from 12 countries were included, of which six were studies conducted with children. Five studies evaluated active travel interventions. Nineteen were prospective cohort studies which did not evaluate the impact of a specific intervention. No studies were identified with obesity as an outcome in adults; one of five prospective cohort studies in children found an association between obesity and active travel. Small positive effects on other health outcomes were found in five intervention studies, but these were all at risk of selection bias. Modest benefits for other health outcomes were identified in five prospective studies. There is suggestive evidence that active travel may have a positive effect on diabetes prevention, which may be an important area for future research.
Conclusions: Active travel may have positive effects on health outcomes, but there is little robust evidence to date of the effectiveness of active transport interventions for reducing obesity. Future evaluations of such interventions should include an assessment of their impacts on obesity and other health outcomes.
Publication types
- Meta-Analysis
- Research Support, N.I.H., Extramural
- Systematic Review
- Child, Preschool
- Clinical Trials as Topic
- Prospective Studies
Grants and funding
- 09/3001/13/DH_/Department of Health/United Kingdom
Active travel
Why travel actively, get on your bike, go electric, supporting longer journeys.
- get healthier
- reduce your carbon emissions
Active travel is all about getting you moving from A to B in ways that don’t use fossil fuels. Active travel improves your health and wellbeing, as well as reducing your carbon footprint and saving you money.
The sustainable travel hierarchy is a useful way to think about improving the impact of your journeys. The higher up the hierarchy, the more sustainable and greener the travel option. The most sustainable option is walking where the only resource required is you, followed by cycling which requires some equipment. Along with wheeling (the term used for wheelchair users), these methods of travel are classed as active travel.

- Save money – cars can be expensive; not just to purchase or lease. On average, vehicle tax, maintenance and insurance alone costs £1,100 per year – grab yourself some trainers or a bike and save money!
- Improve your health and happiness – walking regularly can reduce the risk of cardiovascular disease by 35%, while active travel helps manage stress and weight.
- Help the planet and your community – switching from fossil fuelled vehicles to active travel will cut congestion, carbon dioxide (CO2) emissions and other air pollutants that endanger public health and ecosystems.
- Be social – walking is a great option for group journeys when you can walk and chat, while cyclists can find a great sense of community.
- It’s quicker than you think – on average, you can walk a mile in around 15 – 20 minutes or cycle this in five. It could take longer to find your car keys!

Walking or wheeling are great travel options and are also the most accessible – walking costs nothing while wheeling provides more opportunity to access the benefits of active travel.
Small steps make a difference – choosing to walk or wheel just one mile to the shop and back once a week rather than drive will see fuel savings of £25 and 40kg in CO2 annually. Carrying shopping bags home also helps build strength, keeping muscles, bones and joints strong. You won’t need to go to the gym for that workout!
For tips on walking, why not check out these resources?
- Living Streets UK ’s 20 tips for walking, also see their ‘ Walk to school ’ campaign to get the whole family involved
- Ramblers Wellbeing Walks (England only)
- Paths for all (Scotland only)

Rather than walk, you may prefer cycling for longer distances. There’s a national cycle network , in addition to the many dedicated cycle routes in towns and cities across the UK, so there’s no limit to how far your bike can take you.
- Cycling builds muscle and is linked to improved heart and lung capacity.
- In towns and cities, cycling can save time as you filter through the traffic and avoid the queues.
- The UK government allocated £2 billion towards walking and cycling infrastructure, meaning cycling routes and accessibility are expected to improve.
If you are looking to purchase a bike or cargo bike, why not look in your area for community groups offering reconditioned bikes to save your carbon footprint even further. Alternatively, you may wish to purchase a bike via your employer’s c ycle to work scheme.
Cycling UK has lots more cycling tips and advice on its website.
Funding may be available to help you get your neglected bike back on the road. Look at Scotland’s Cycle repair scheme , for example.

If you need some assistance with your cycling, why not go electric? Ebikes and ecargo bikes have an electric motor and battery to help you cover longer journeys more easily than on a conventional cycle. Ebikes and ecargo bikes have grown in popularity in recent years, it’s likely you have seen them in your local area and not noticed the difference.
Ebikes and ecargo bikes:
- Are ideal for anyone who might find cycling physically challenging.
- Provide between 25–100 miles of pedalling enhancement on a single charge
- Give you an extra boost to cover those long journeys or big hills
- Emit 742 times less CO2 per mile than the average petrol or diesel car.
Find out more on our electric bikes advice page or explore our information on ecargo bikes .
There may be instances when active travel isn’t a suitable option, for example you may be travelling a long distance or have a large load.
For these journeys why not consider using a combination of active travel and shared transport?
It all adds up…
- Choosing to commute by walking or cycling once a week could save around 40kg of CO2 a year.
- Reducing your car use by a quarter could save up to £250 in fuel costs and 360kg of CO2 a year.
- At least 150 minutes of moderately intense exercise per week helps reduce your risk of developing a number of mental and physical health conditions: depression by 30%, cardiovascular disease by 35% and type II diabetes by 40% ( source: UK Chief Medical Officer’s physical activity guidelines 2019).
- Cycling for 10 miles on an ebike costs as little as 4p in electricity if you charge at home.
- By walking, cycling or wheeling you are reducing congestion and pollution, making local spaces more enjoyable, quieter and healthier.
Active travel support in Scotland
If you’re living in Scotland and want advice on active travel and funding that may be available to you, get in touch with Home Energy Scotland on 0808 808 2282 or through the contact form .
Related pages
Electric bikes, electric vehicles, shared travel options, active travel: the benefits of walking, wheeling and cycling, more information.
Explore Living Streets' pages and resources.
Plan your next journey using the National Cycle Network.
Cycling UK has some useful tips and advice for new cyclists.
Last updated: 16 April 2024
For our site to work, we use essential cookies. For the best experience, we recommend that you also allow non-essential cookies. You can read about how we use cookies on our privacy page
Tell us where you live
Get the most relevant content from Energy Saving Trust by telling us where you live
- Northern Ireland
- International
You must accept preferences cookies to view location-specific content.

- print Print
- error Feedback

The Active Travel Act: 10 years on
Early October saw Members, stakeholders and supporters come together to mark the ten year anniversary of the Active Travel (Wales) Act being passed unanimously by the Senedd. Described by Sustrans in 2013 as “pioneering legislation”, the Welsh Government set out “to make walking and cycling the most natural and normal way of getting about”.
But ten years on, has it achieved what it set out to do?
What is active travel and what are the benefits?
‘Active travel’ refers to everyday journeys made by walking, cycling or wheeling . The Act focuses on travelling this way for a purpose, such as travel to school or work, rather than purely for leisure.
It’s the cheapest and greenest form of transport making it the most accessible and climate-friendly mode. Evidence from multiple UK longitudinal population studies has found that active travel helps maintain and improve both physical and mental health across an individual’s life.
A 2022 World Health Organisation (WHO) report also found that active commuting is associated with around a 10% decrease in risk for cardiovascular disease and a 30% decrease in type 2 diabetes risk.
Sustainable transport charity Sustrans’ report on active travel and the cost-of-living suggests that, in addition to helping individuals save money, active travel can boost economic growth. It highlights the benefits to high streets and town centres with research suggesting that walking and cycling improvements can increase local retail spend by up to 30%.
What does the Act do?
Among other provisions, it places a duty on the Welsh Government and local authorities to continuously improve active travel provision through securing new and improved active travel routes and related facilities. It also requires local authorities to prepare Active Travel Network Maps (ATNMs) every three years showing existing active travel routes, alongside new proposed routes.
How are active travel improvements funded?
Since 2018 the Welsh Government has primarily supported local authorities through its Active Travel Fund . This includes a core allocation for each authority to make small-scale continuous improvements, with the remainder of the funding subject to a competitive bidding process for larger schemes. The Welsh Government also provides funding through other mechanisms, such as the Safe Routes in Communities grant .
Back in 2016, the then Assembly’s Enterprise and Business Committee said “a lack of dedicated funding and a lack of leadership [means the]… Act is falling short of its full potential”. In 2018, the Senedd’s Economy, Infrastructure and Skills (EIS) Committee undertook post-legislative scrutiny of the Act . One of its subsequent recommendations was that Welsh Government funding should be set at £17-£20 per head per annum.
Figure 1: Welsh Government active travel funding per capita 2018-19 to 2023-4
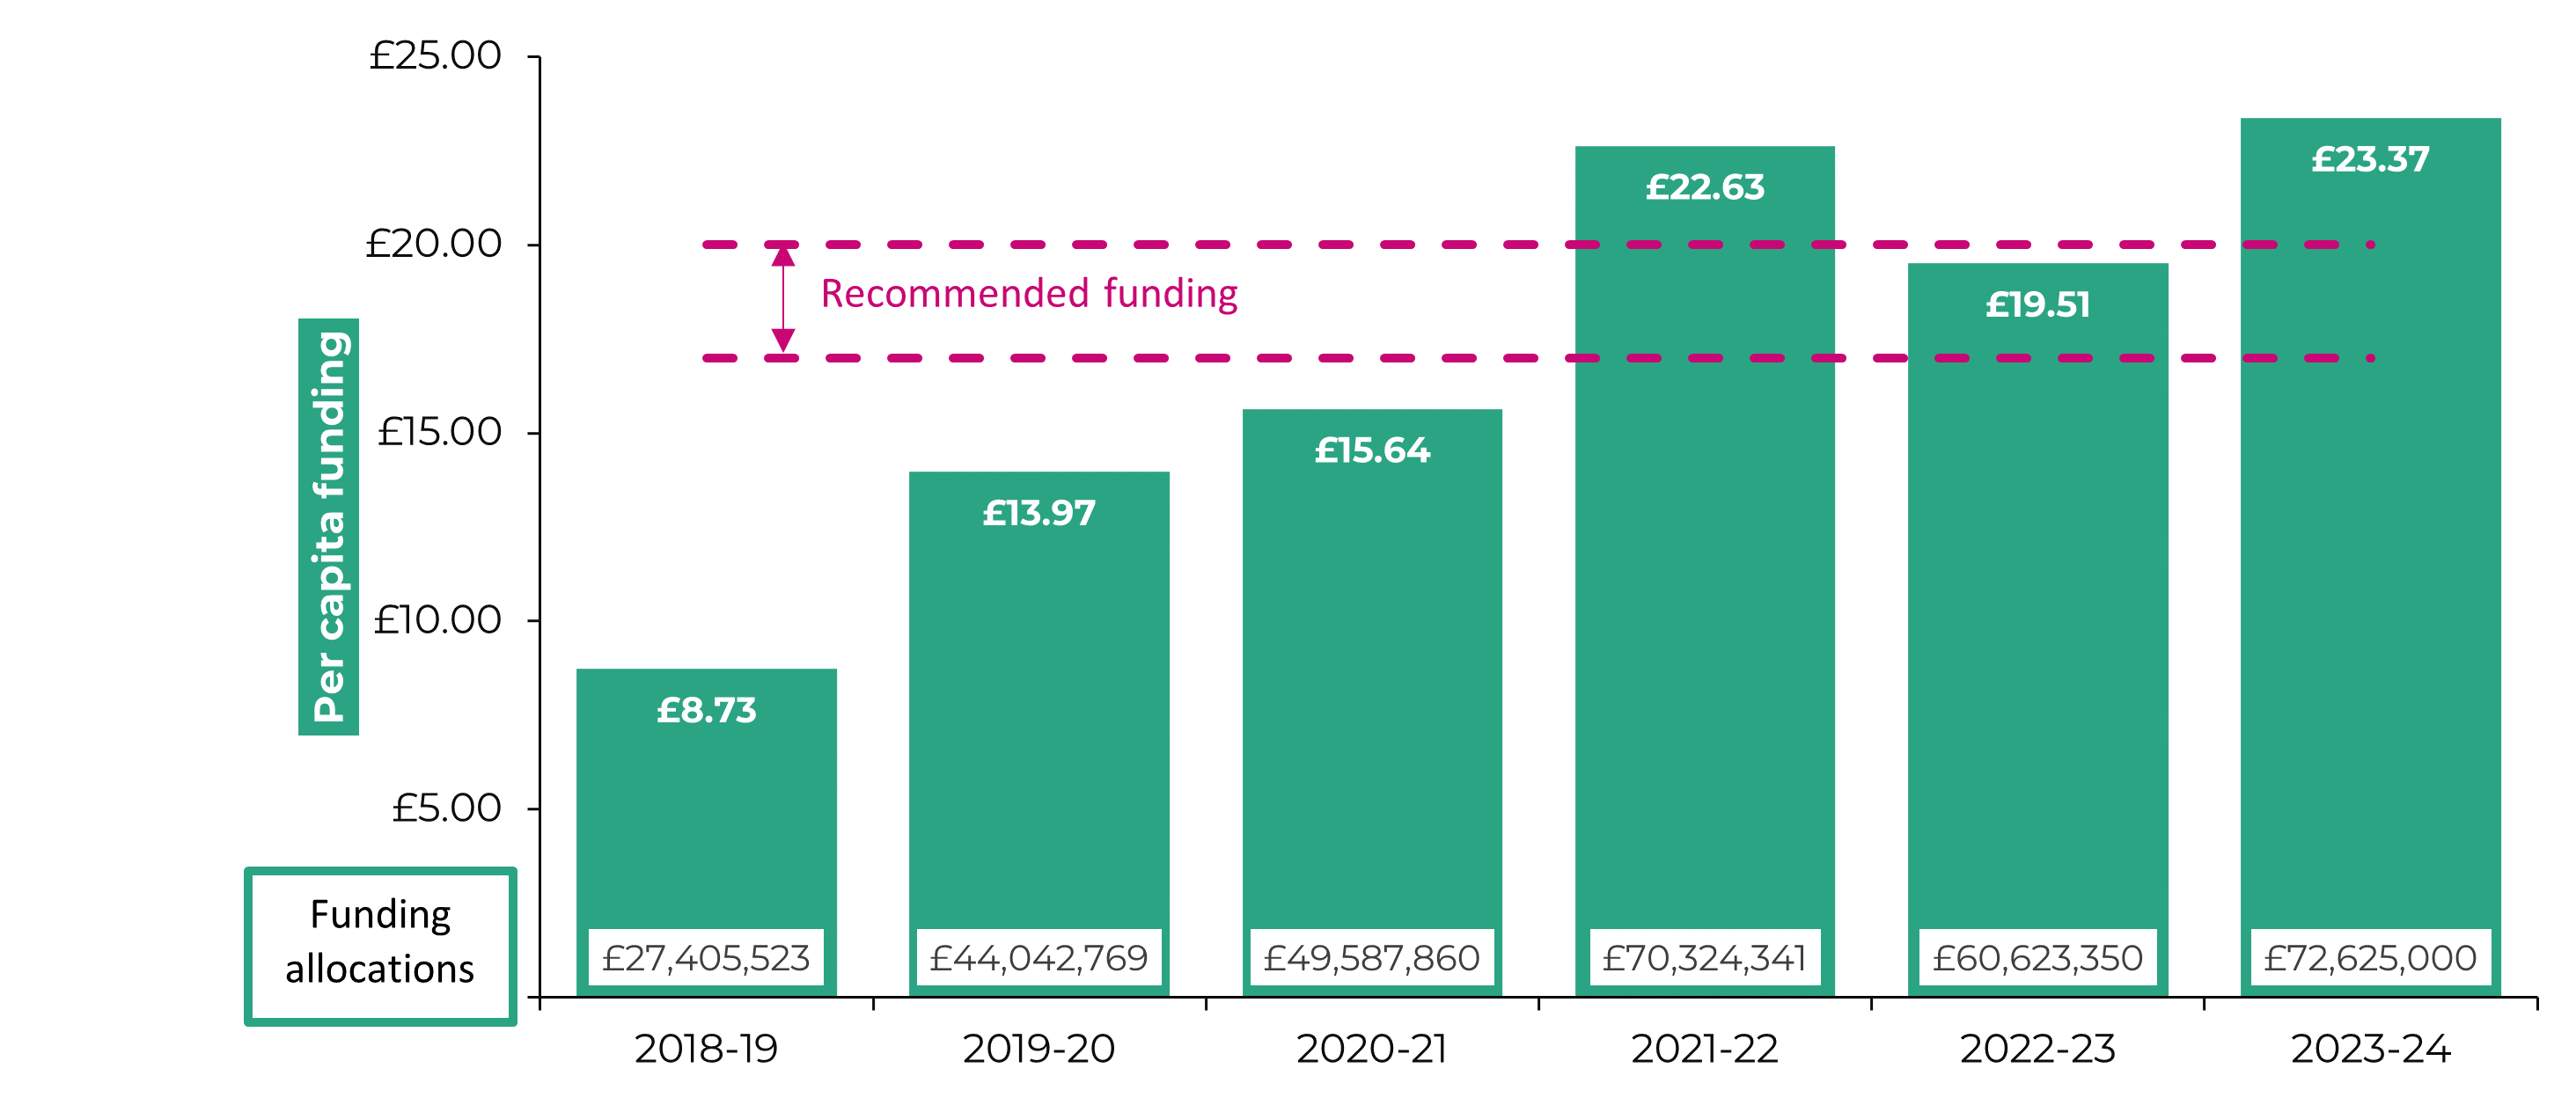
Note: The figures do not include active travel provision within wider project costs such as other public transport and multi-modal schemes, or active travel schemes funded from local authorities’ own budgets.
Source: Paper from the Minister for Climate Change to the Climate Change, Environment and Infrastructure Committee, 25 January 2023 .
While this level was reached in 2021-22, the following year saw funding decrease - albeit still set within the parameters recommended by the EIS Committee. At the time, the Welsh Government said this would be a “short term reduction” and suggested total funding would be set at £80m for 2023-24 and 2024-25. On why this level was not reached for the current financial year, the Deputy Minister for Climate Change, Lee Waters MS said :
We're spending less than we had originally thought we would, and that's partly because…there are some real capacity and capability constraints across local government, and they simply haven't been able to spend all the money that we wanted them to spend.
Have active travel rates increased?
While funding has increased, this hasn’t yet translated into an increase in active travel rates.
Data collected through the National Survey for Wales for 2022-23 shows 51% of adults (age 16+) walked, and 6% of adults (age 16+) cycled at least once a week for active travel purposes.
Results explorer: National Survey for Wales - active travel
In the last three months, how often have you used a bicycle as a means of transport?
In the last three months, how often have you walked for more than 10 minutes as a means of transport?
Derived variable - Walks (10mins+) or cycles at least once a week as means of transport
All respondents, 2016-17 and 2022-23
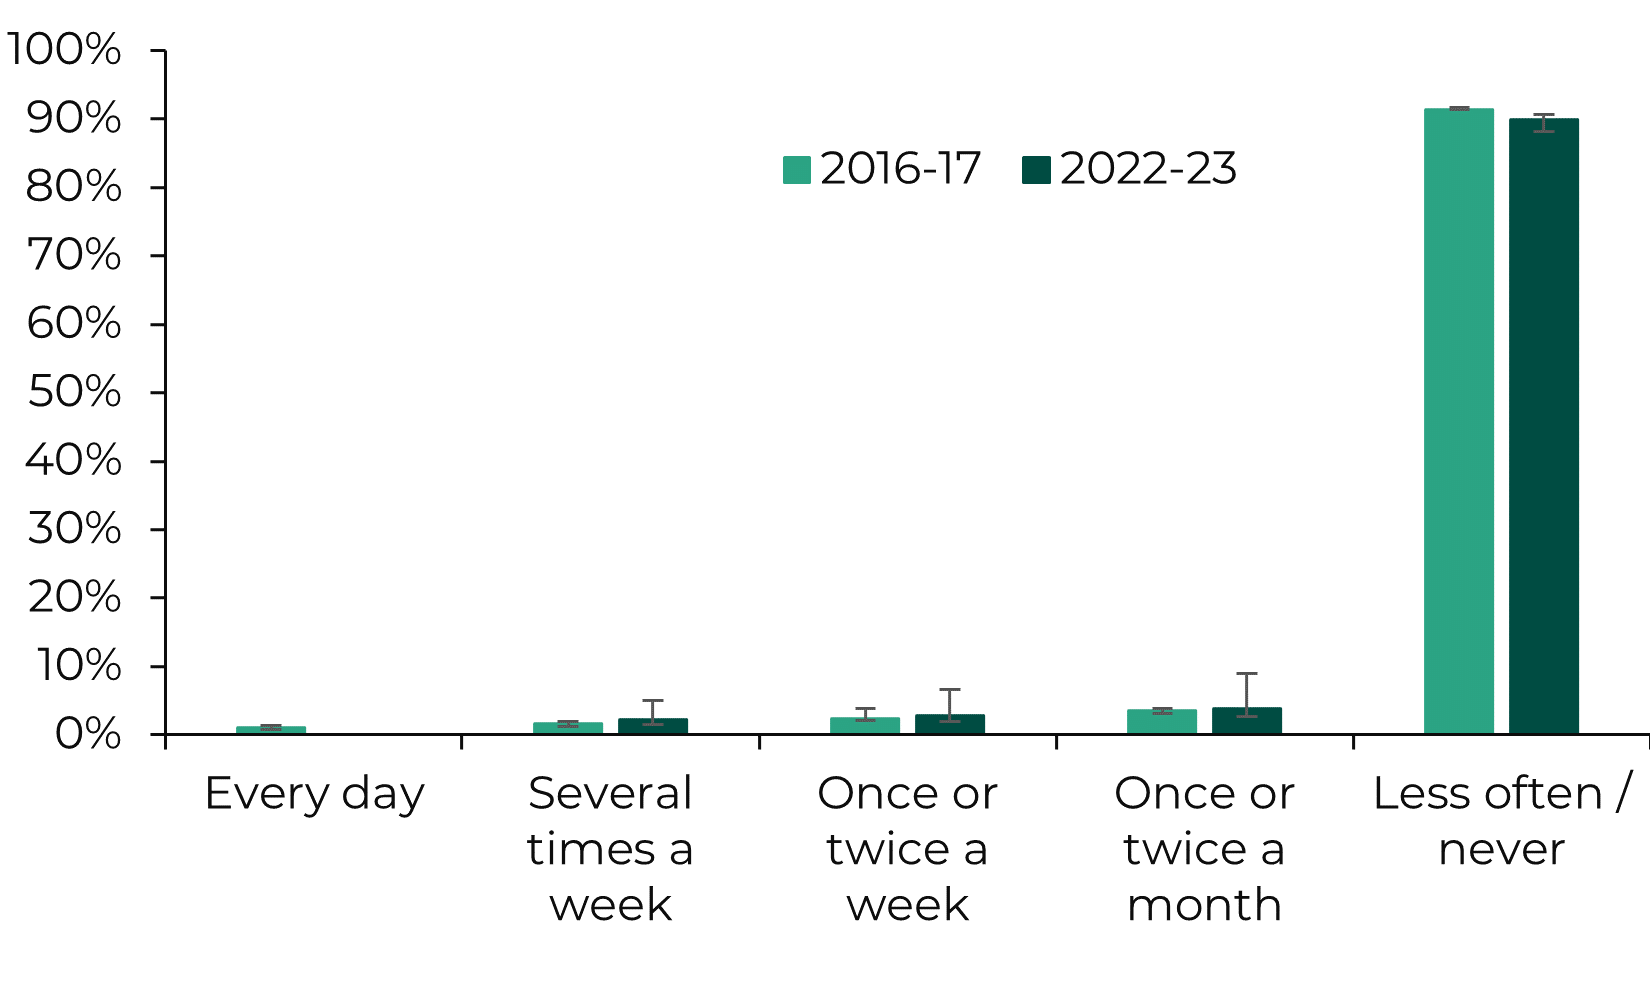
Age group, 2016-17
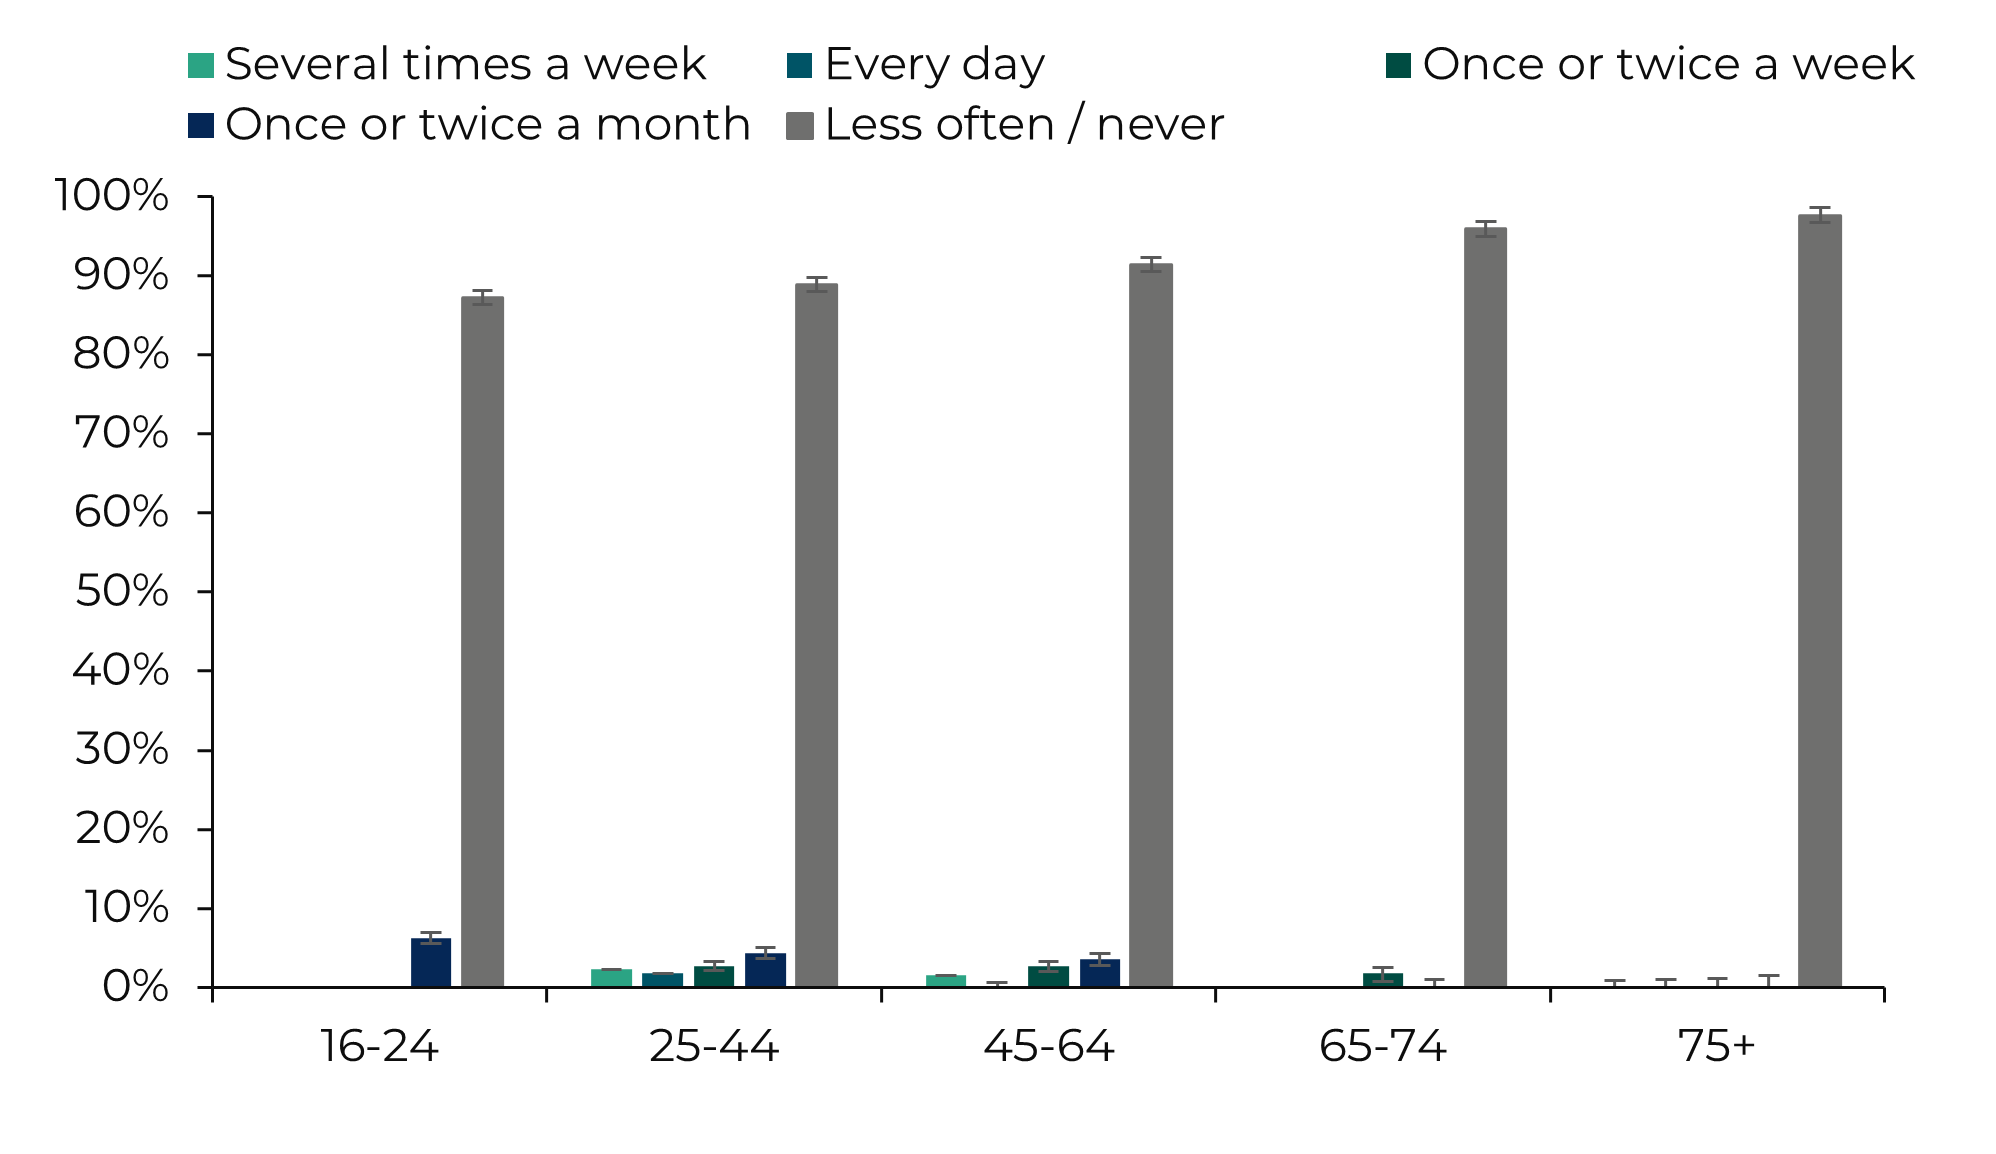
Sex, 2016-17
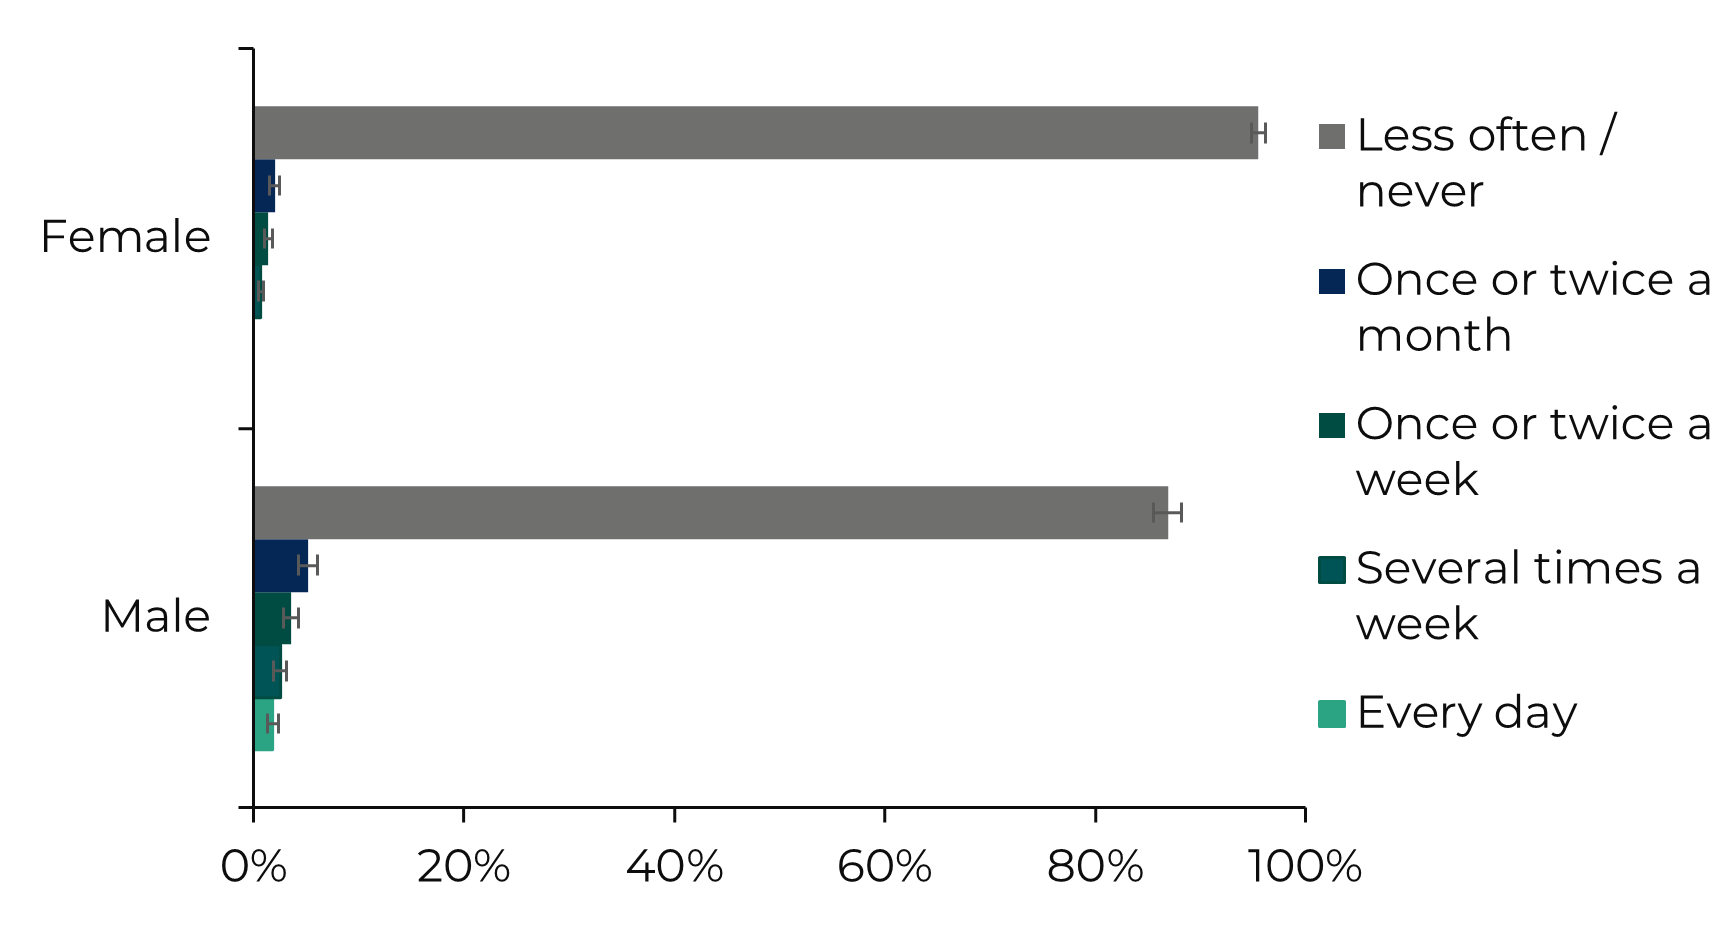
Health, 2016-17
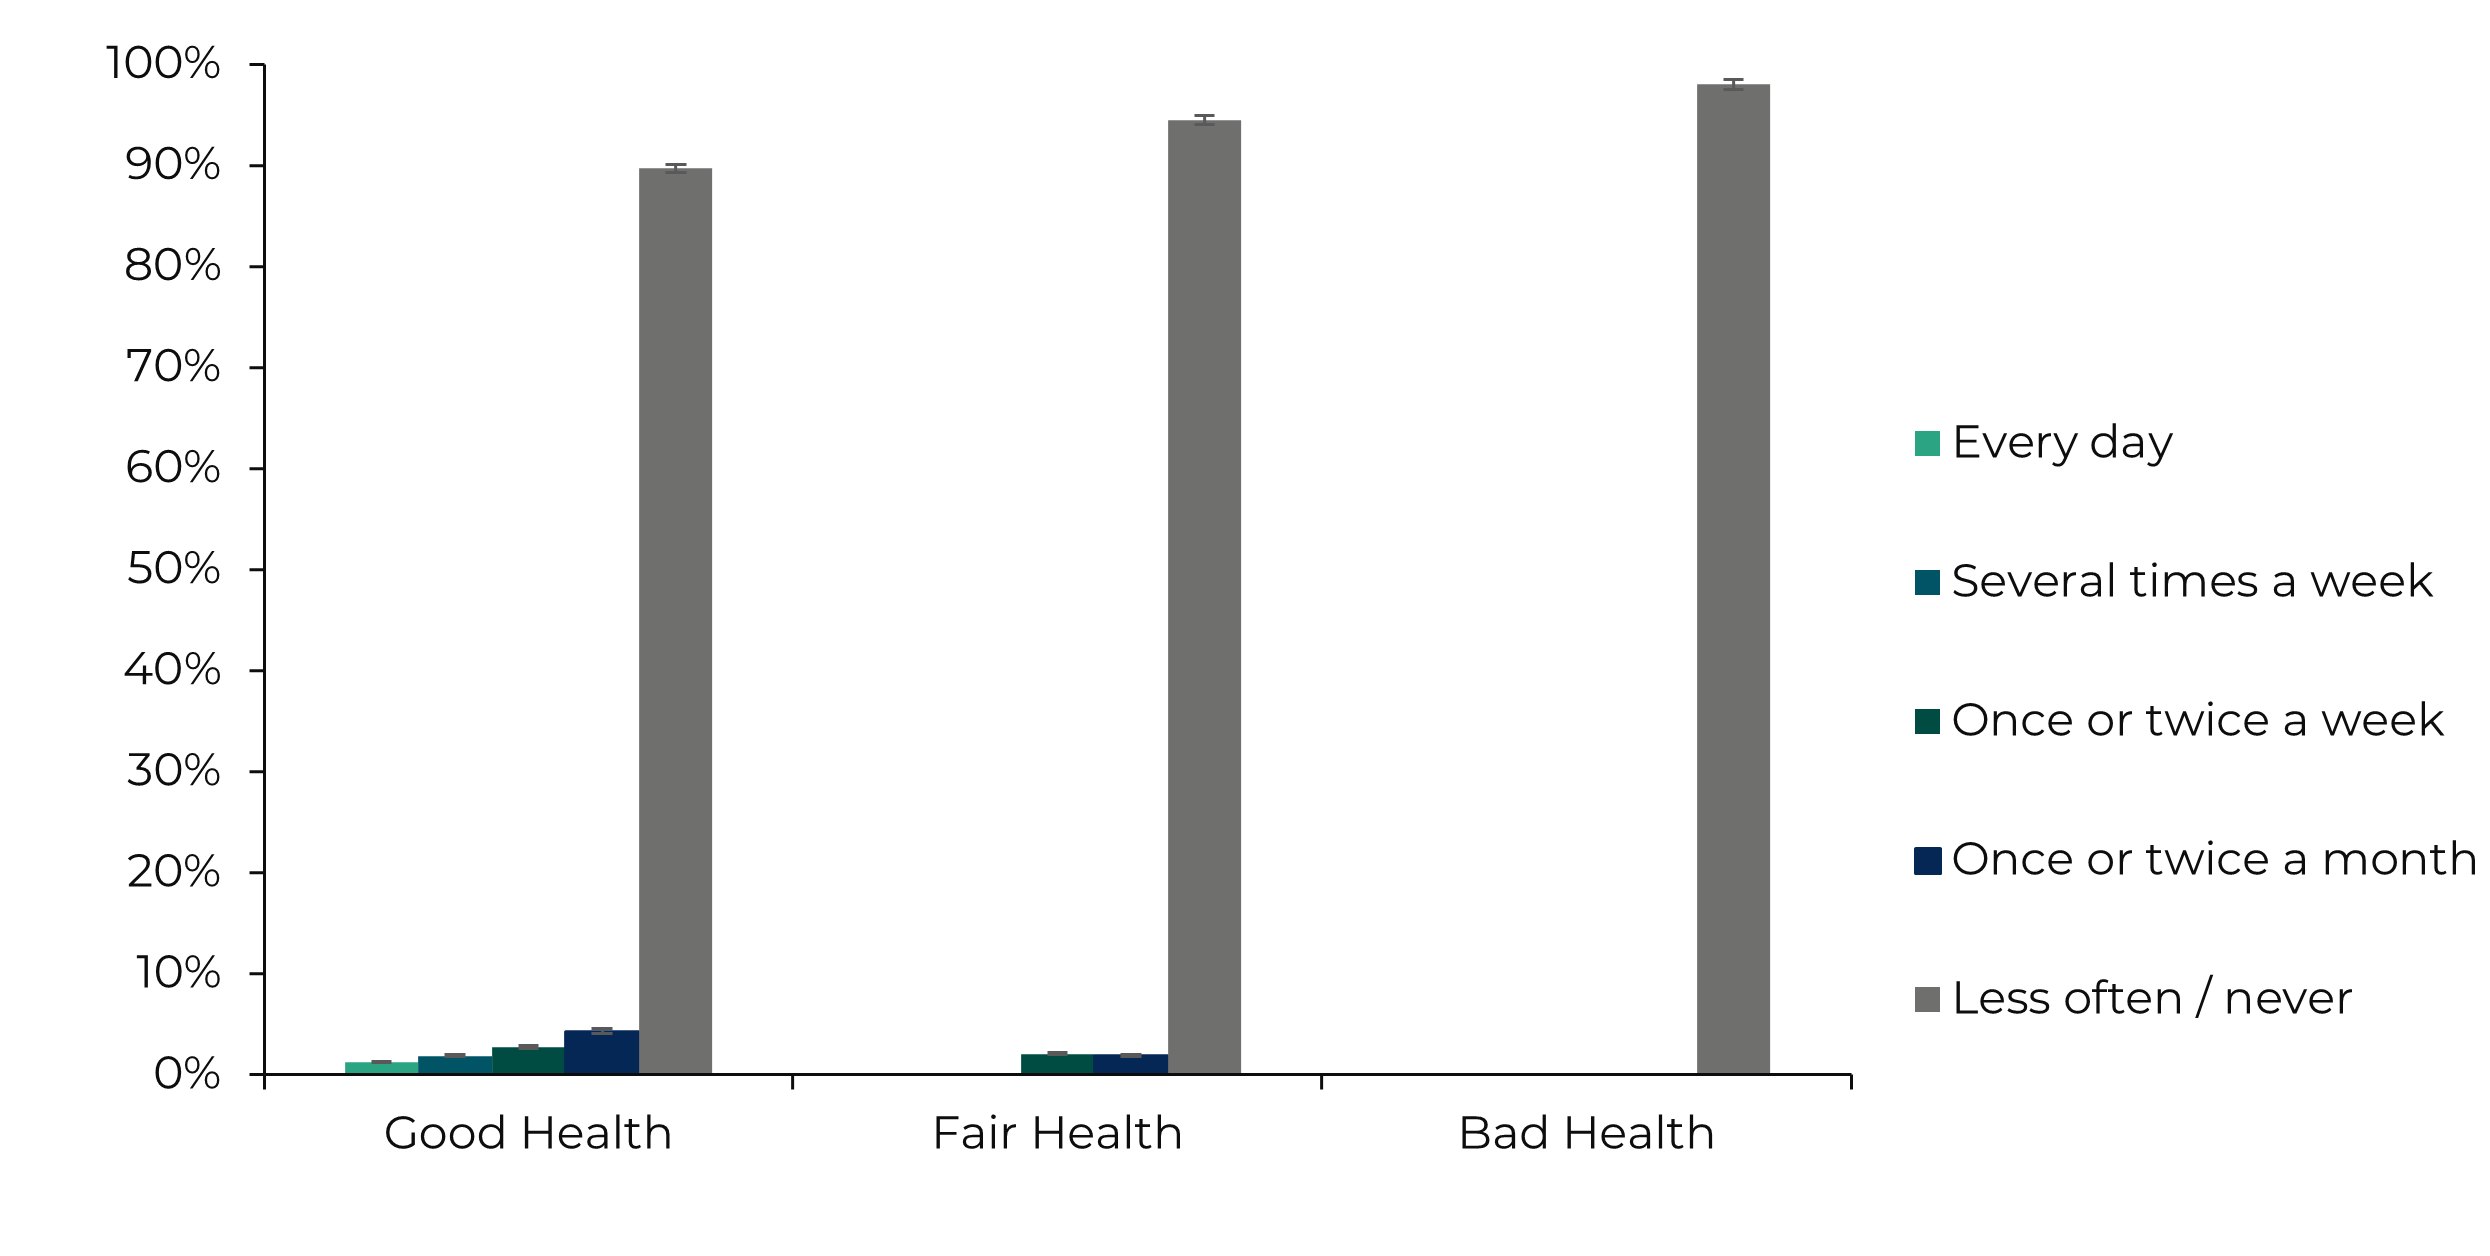
The National Survey for Wales results viewer provides response rates by general health for 2017-18 to 2020-21. For 2021-22 and 2022-23, a breakdown by limiting long-standing illness, disability or infirmity is provided instead. Both are shown here to cover the full time series from 2017-18 to 2022-23.
Has a limiting long-standing illness, disability or infirmity, 2022-23
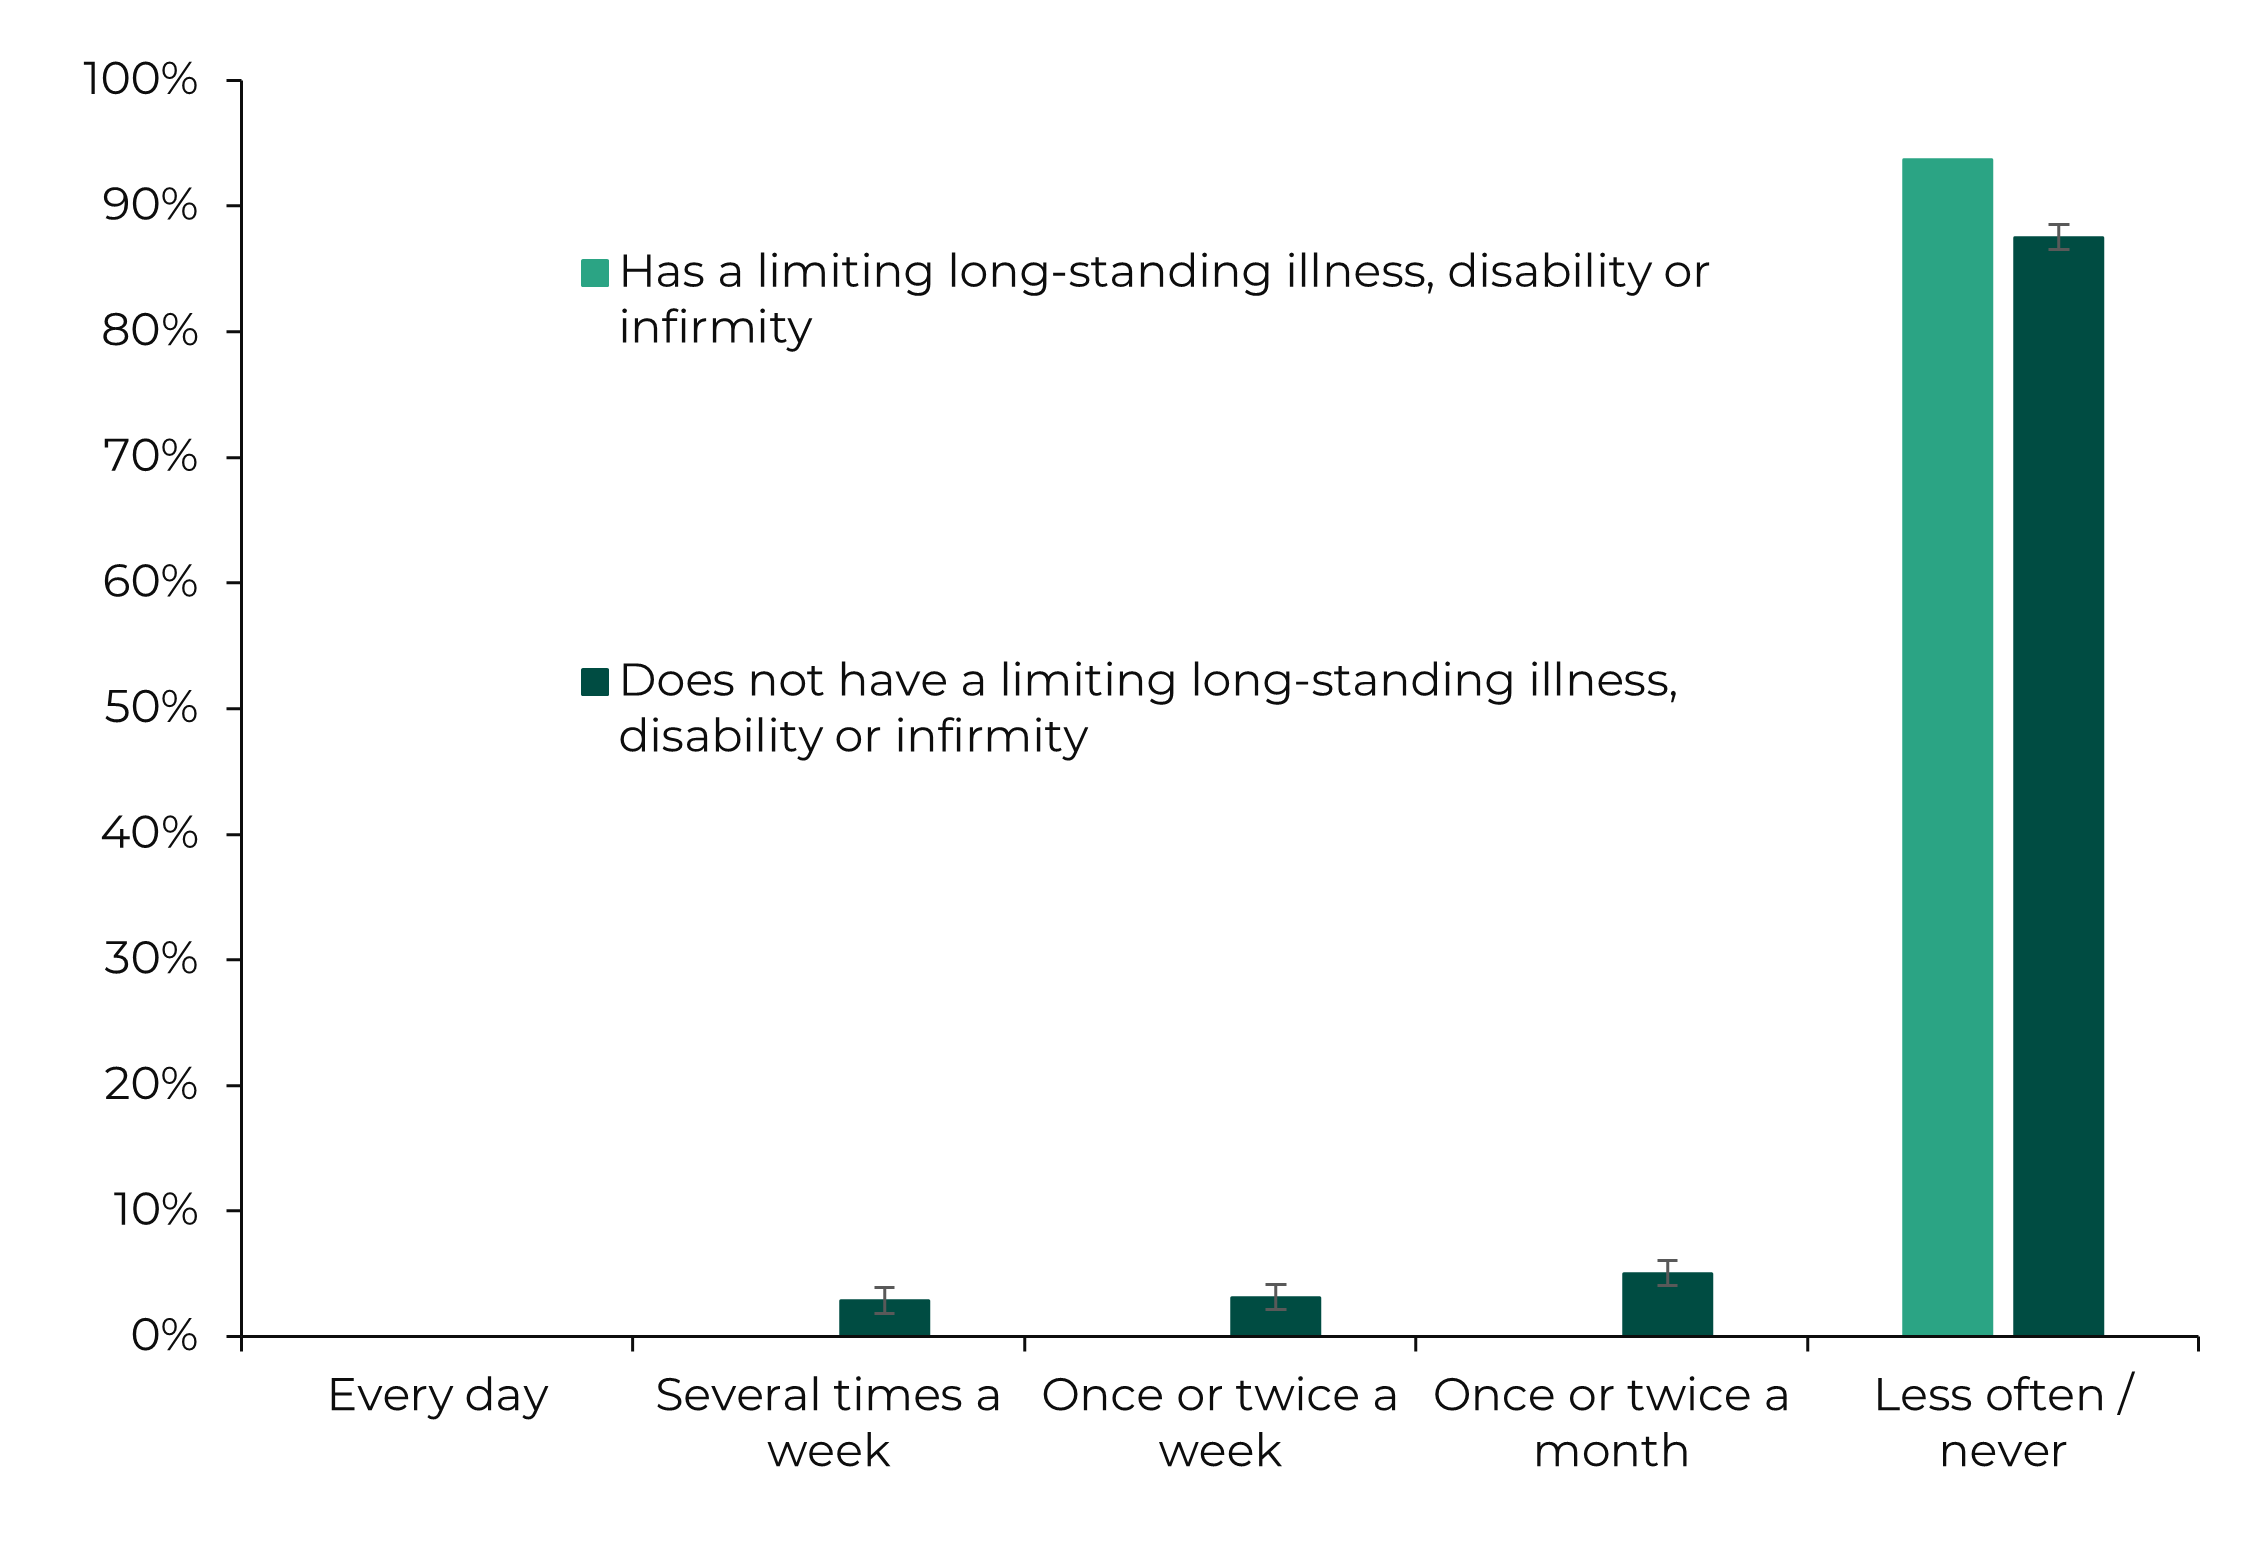
Household in material deprivation (FG indicator), 2016-17
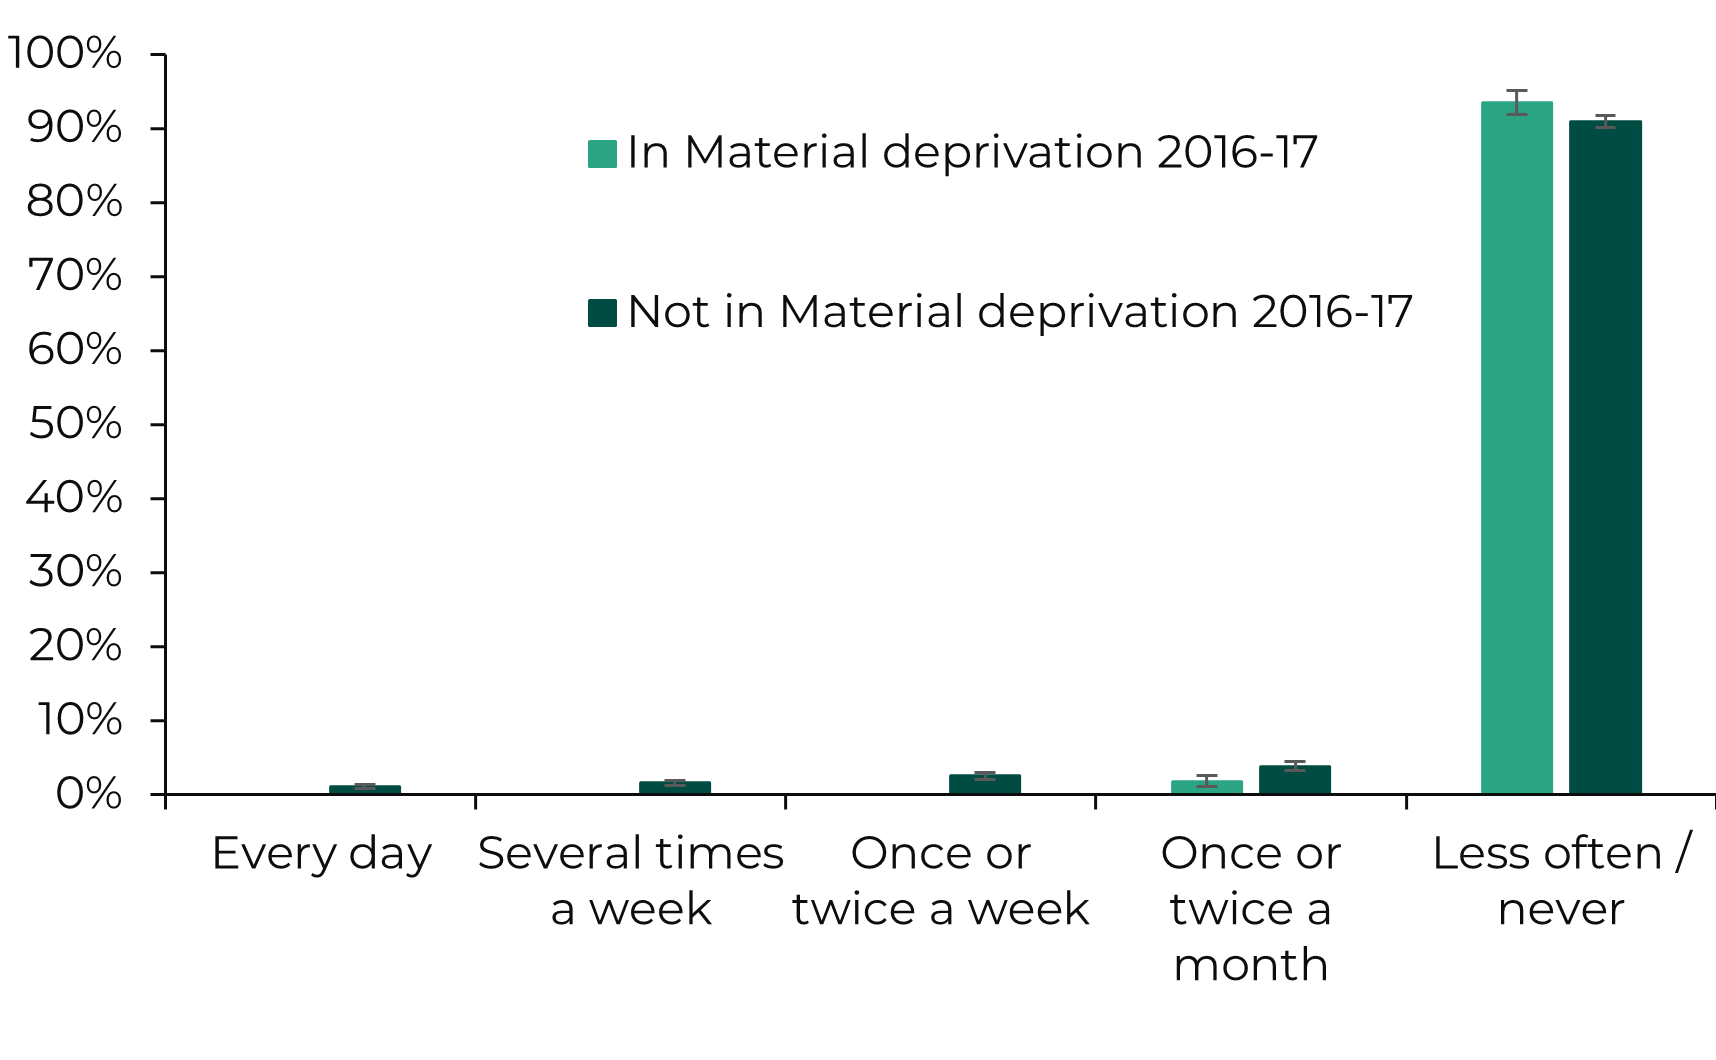
The National Survey for Wales uses the Future Generations indicator for people living in households in material deprivation. This is derived from a series of questions taken from the Family Resources Survey and classifies households using a similar methodology.
Rural/urban classification, 2016-17, 2018-19 and 2022-23
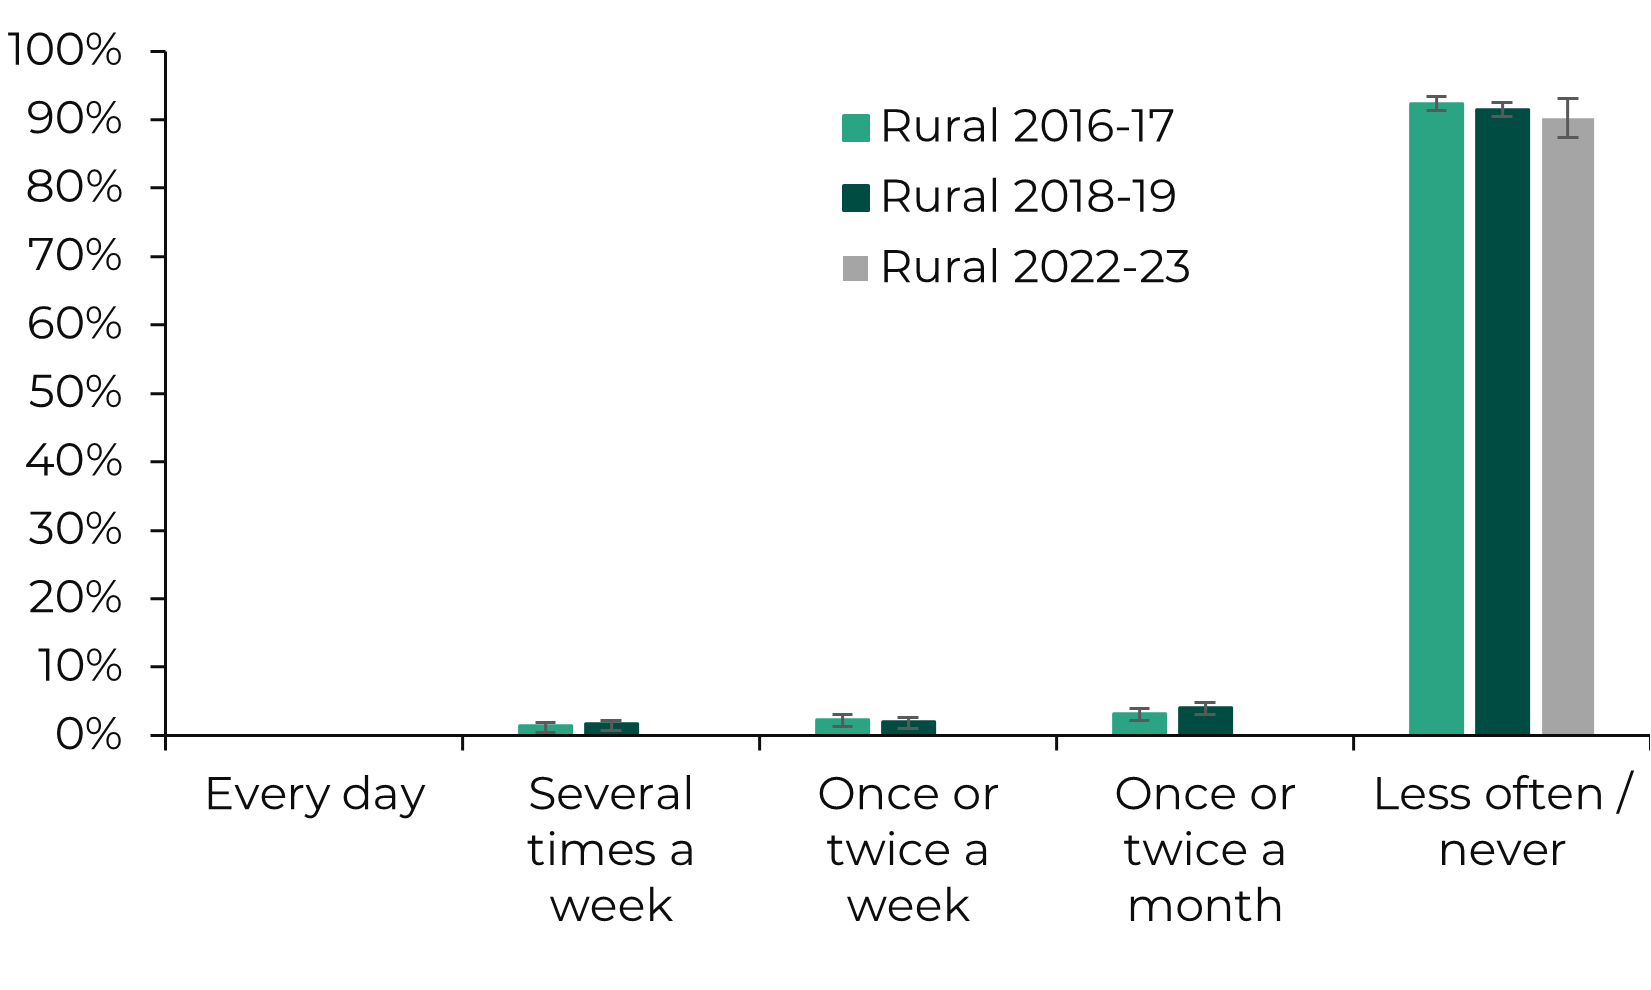
'Urban' includes settlements with a population of 10,000 or more and small towns and their fringes, where the wider surrounding area is less sparsely populated. 'Rural' includes all other areas.
All respondents, 2017-18 to 2022-23
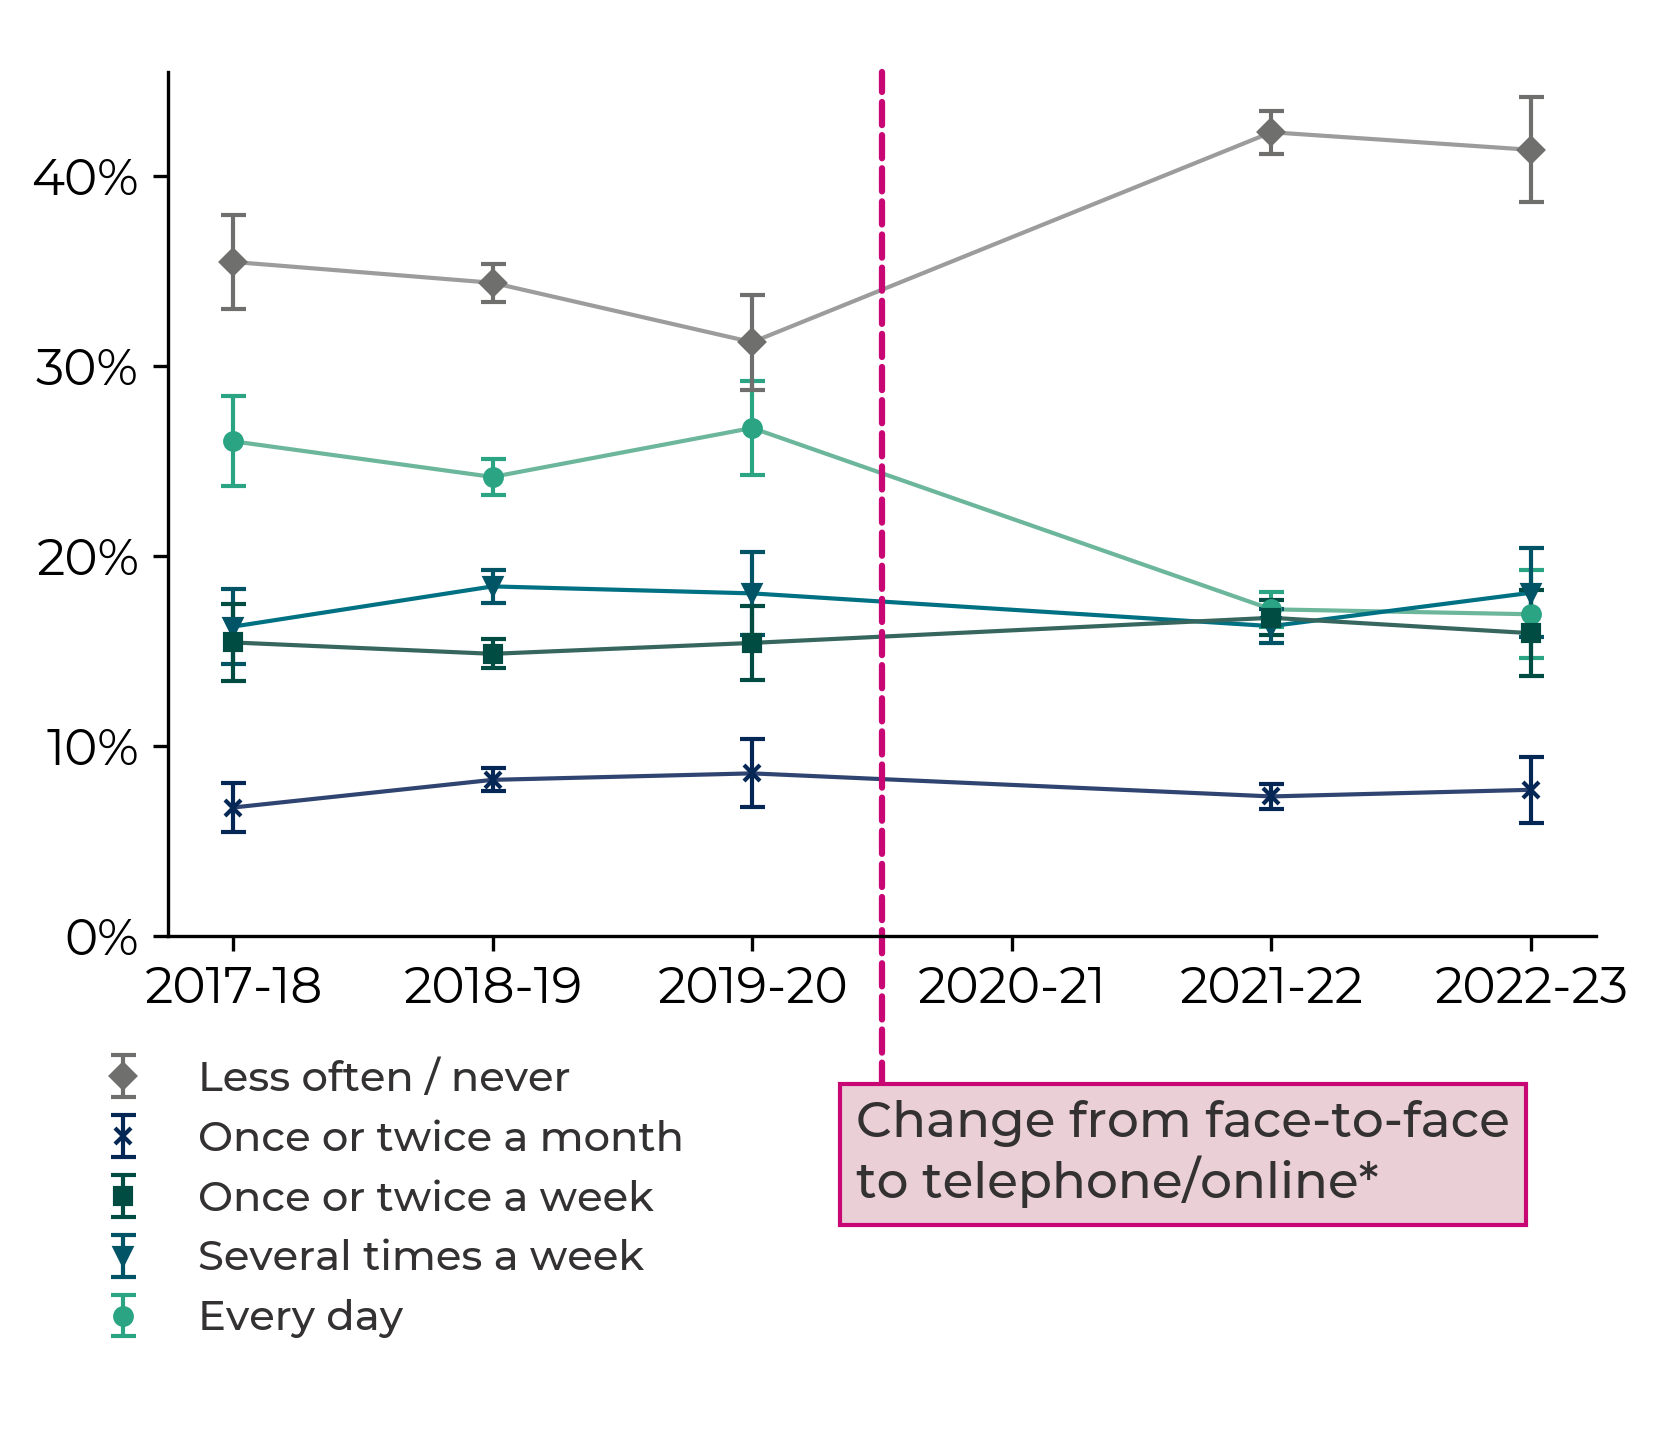
Age group, 2017-18 to 2022-23
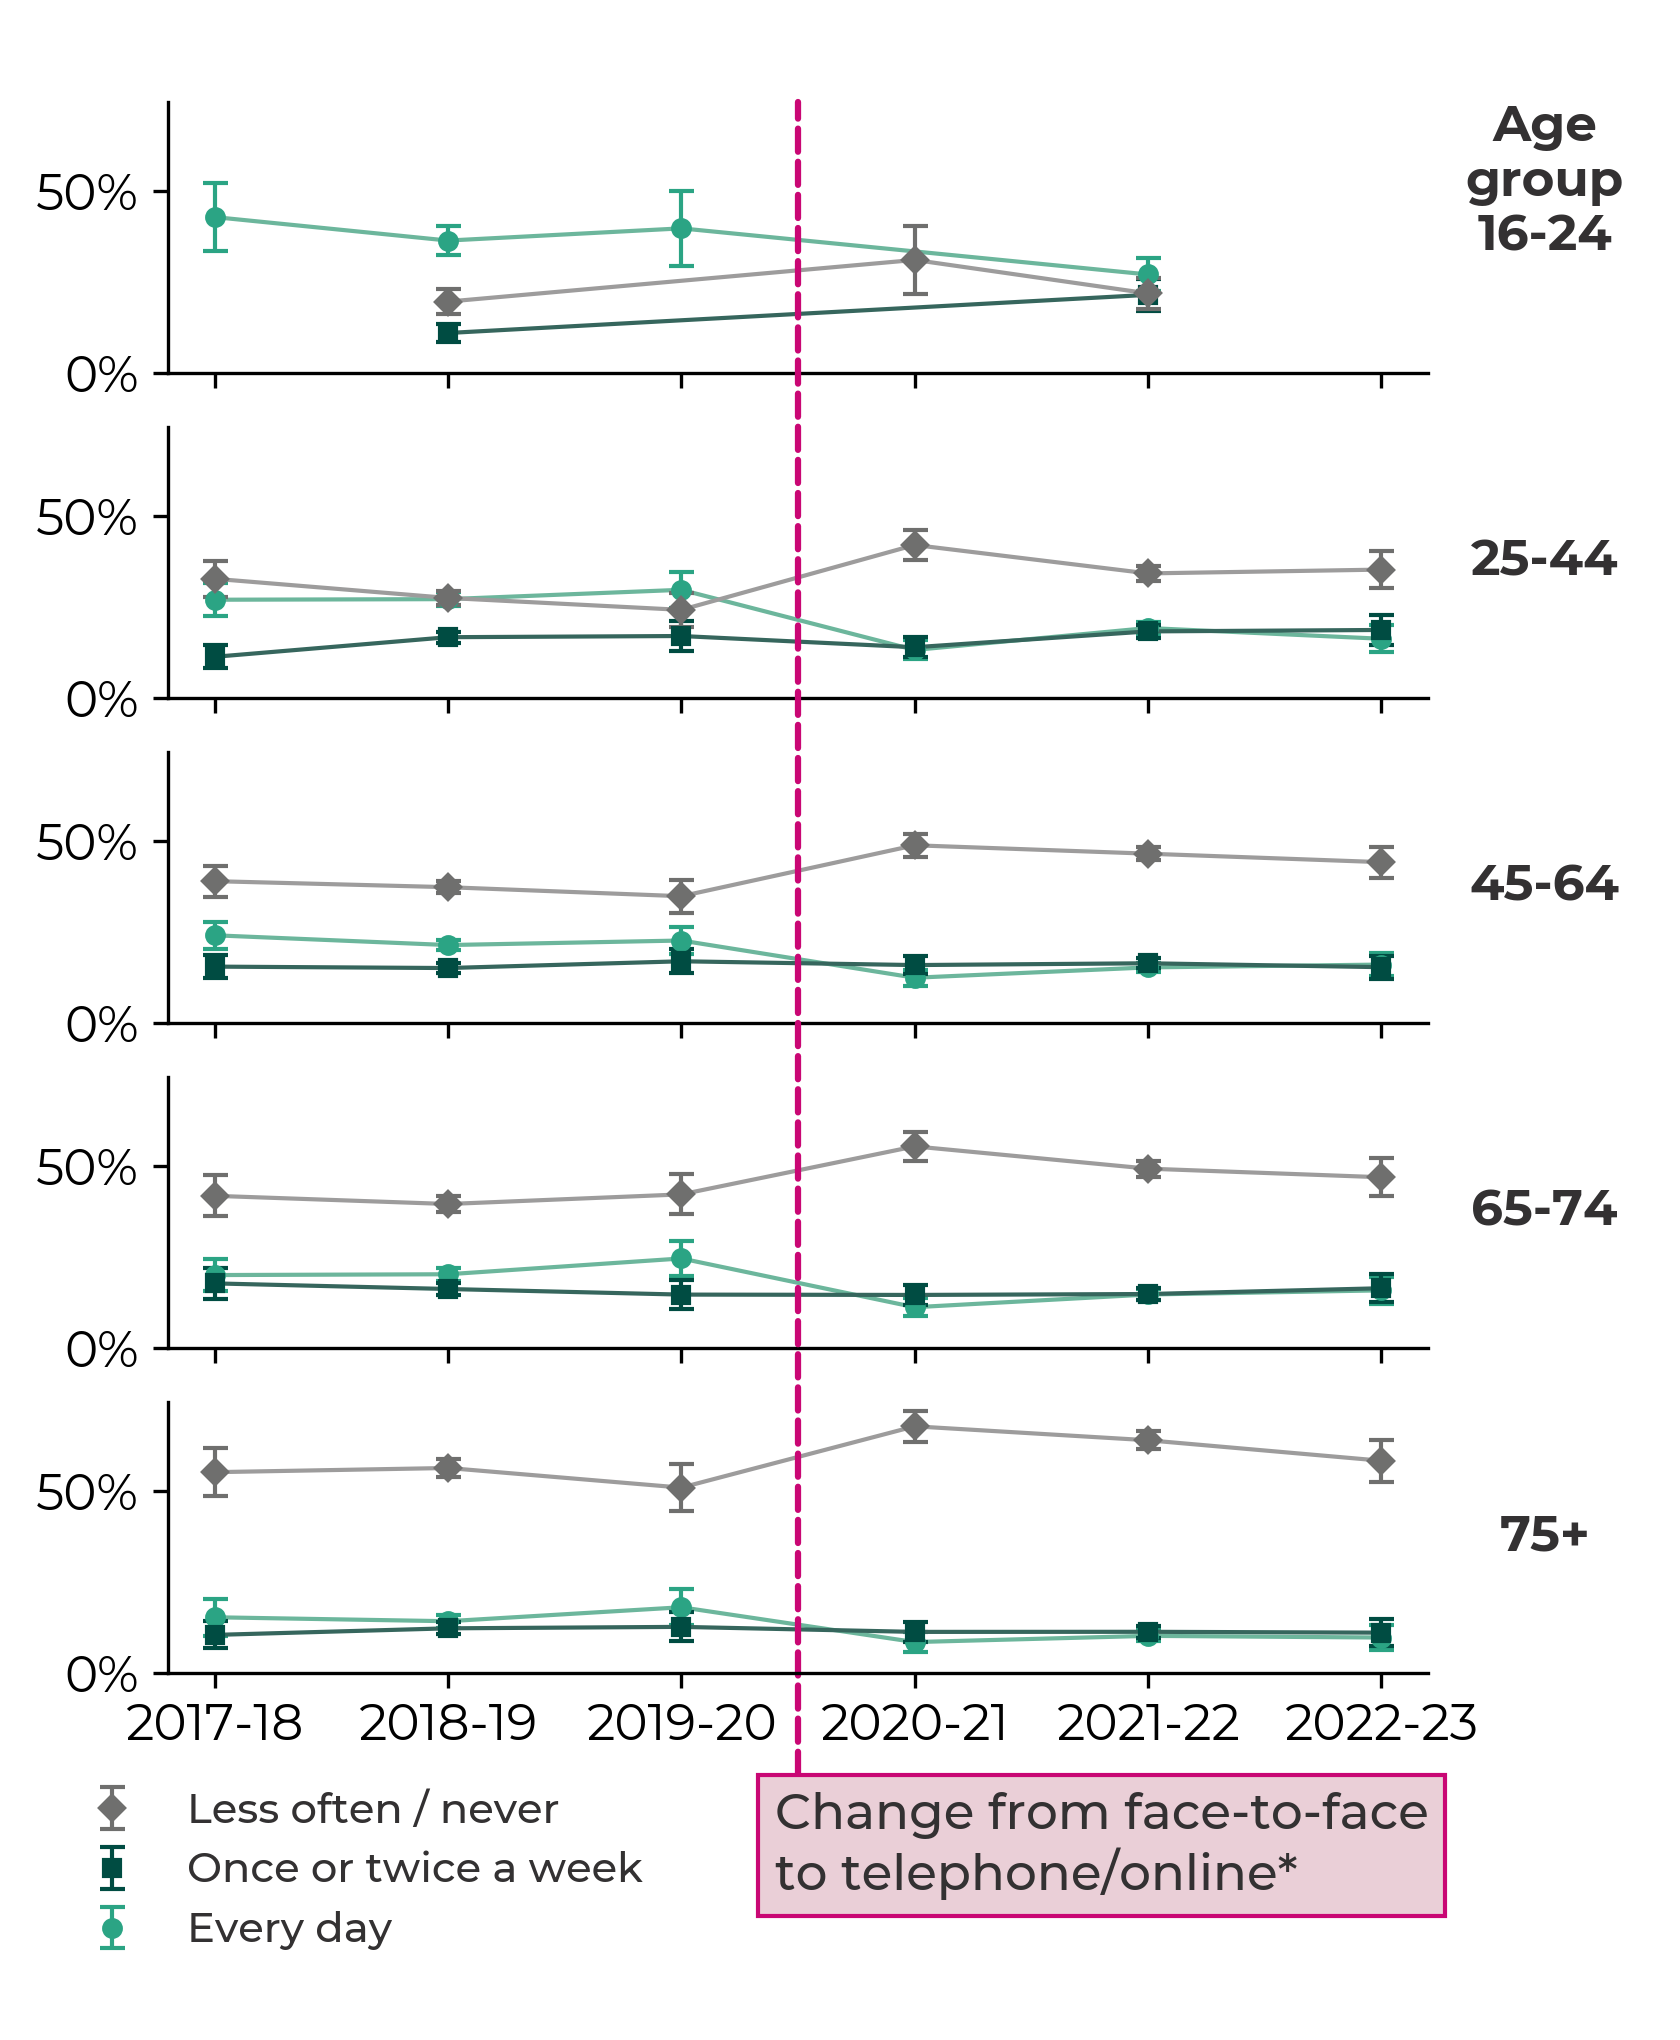
Sex, 2017-18 to 2021-22
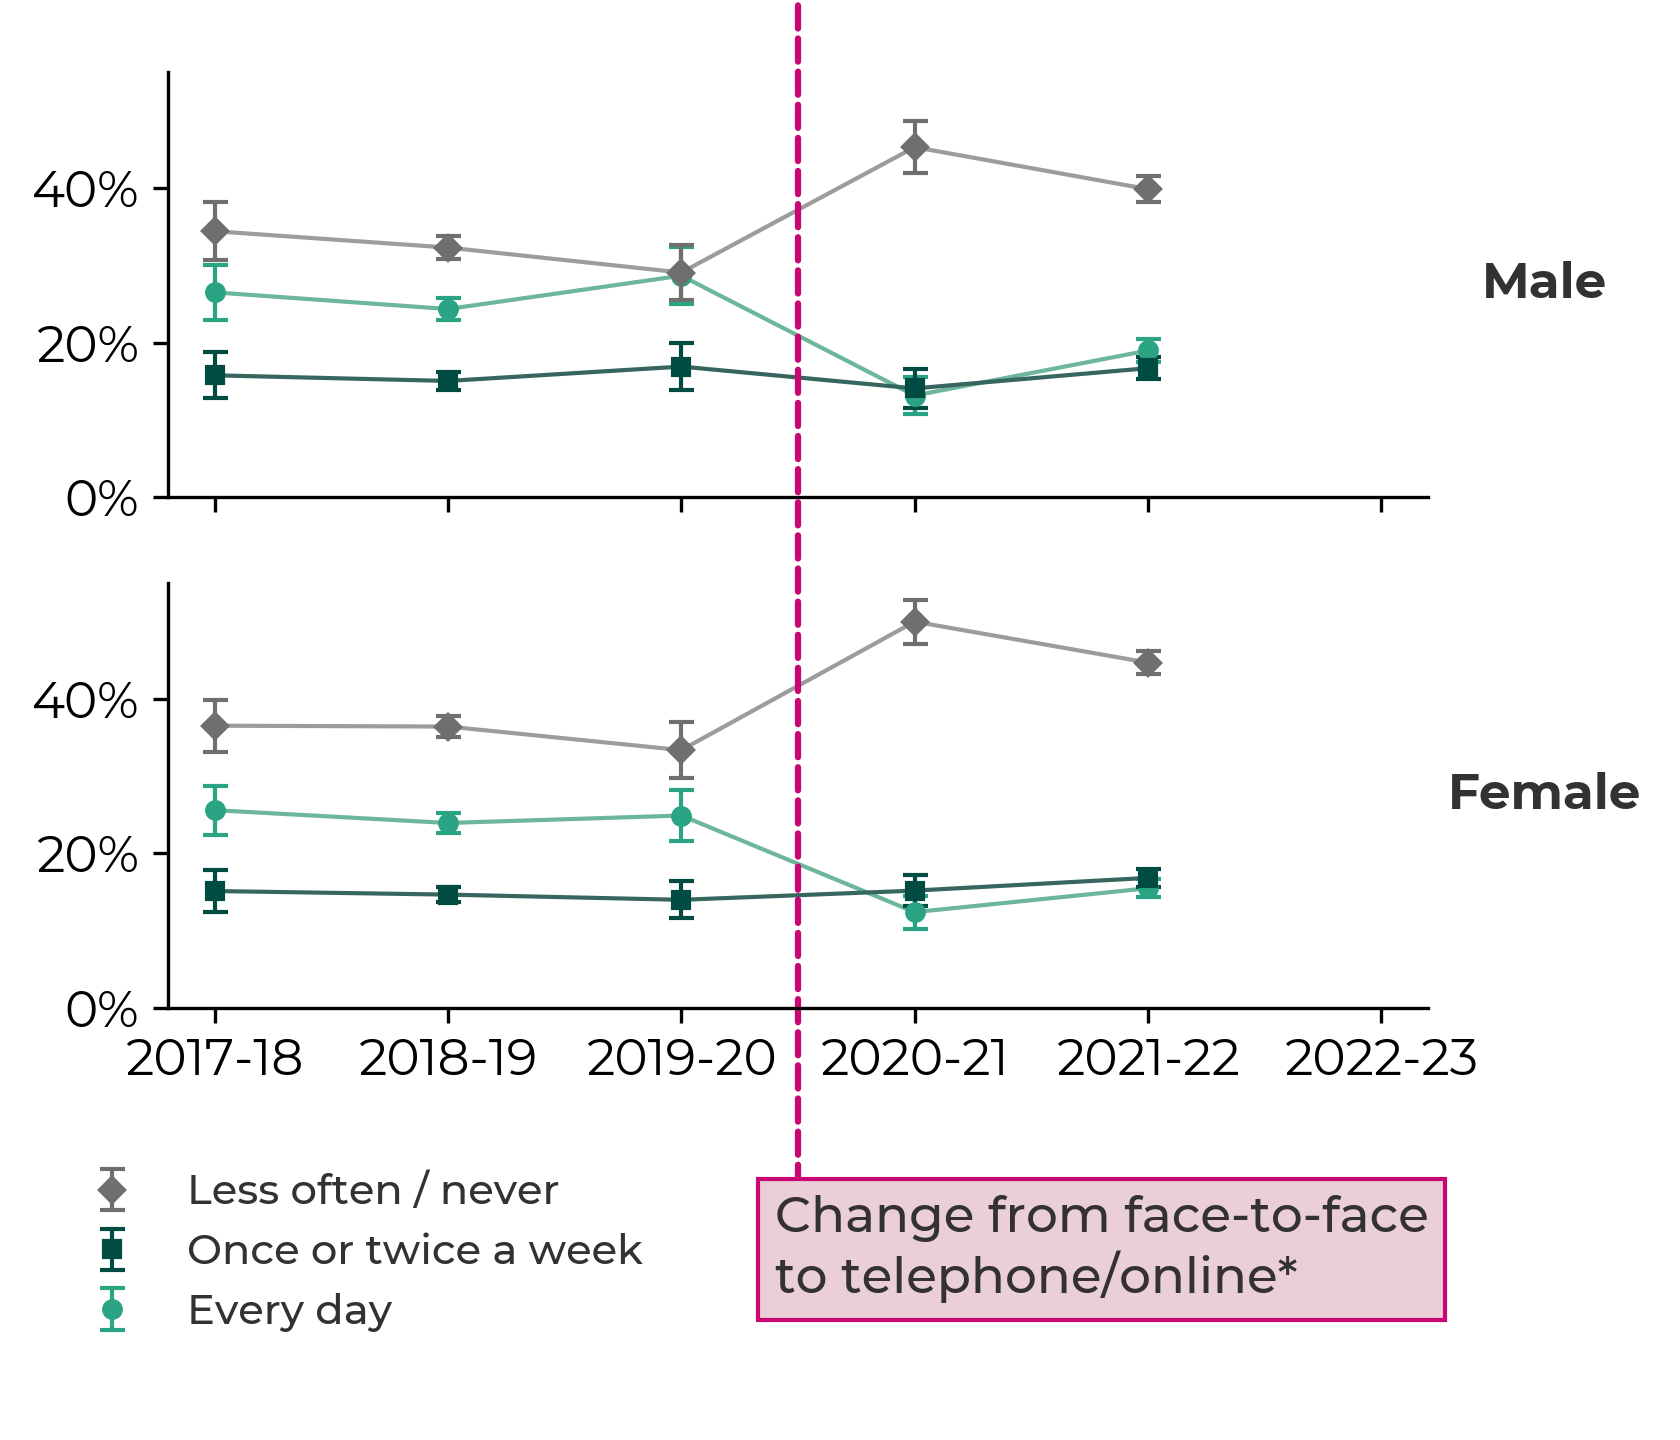
Health, 2017-18 to 2020-21
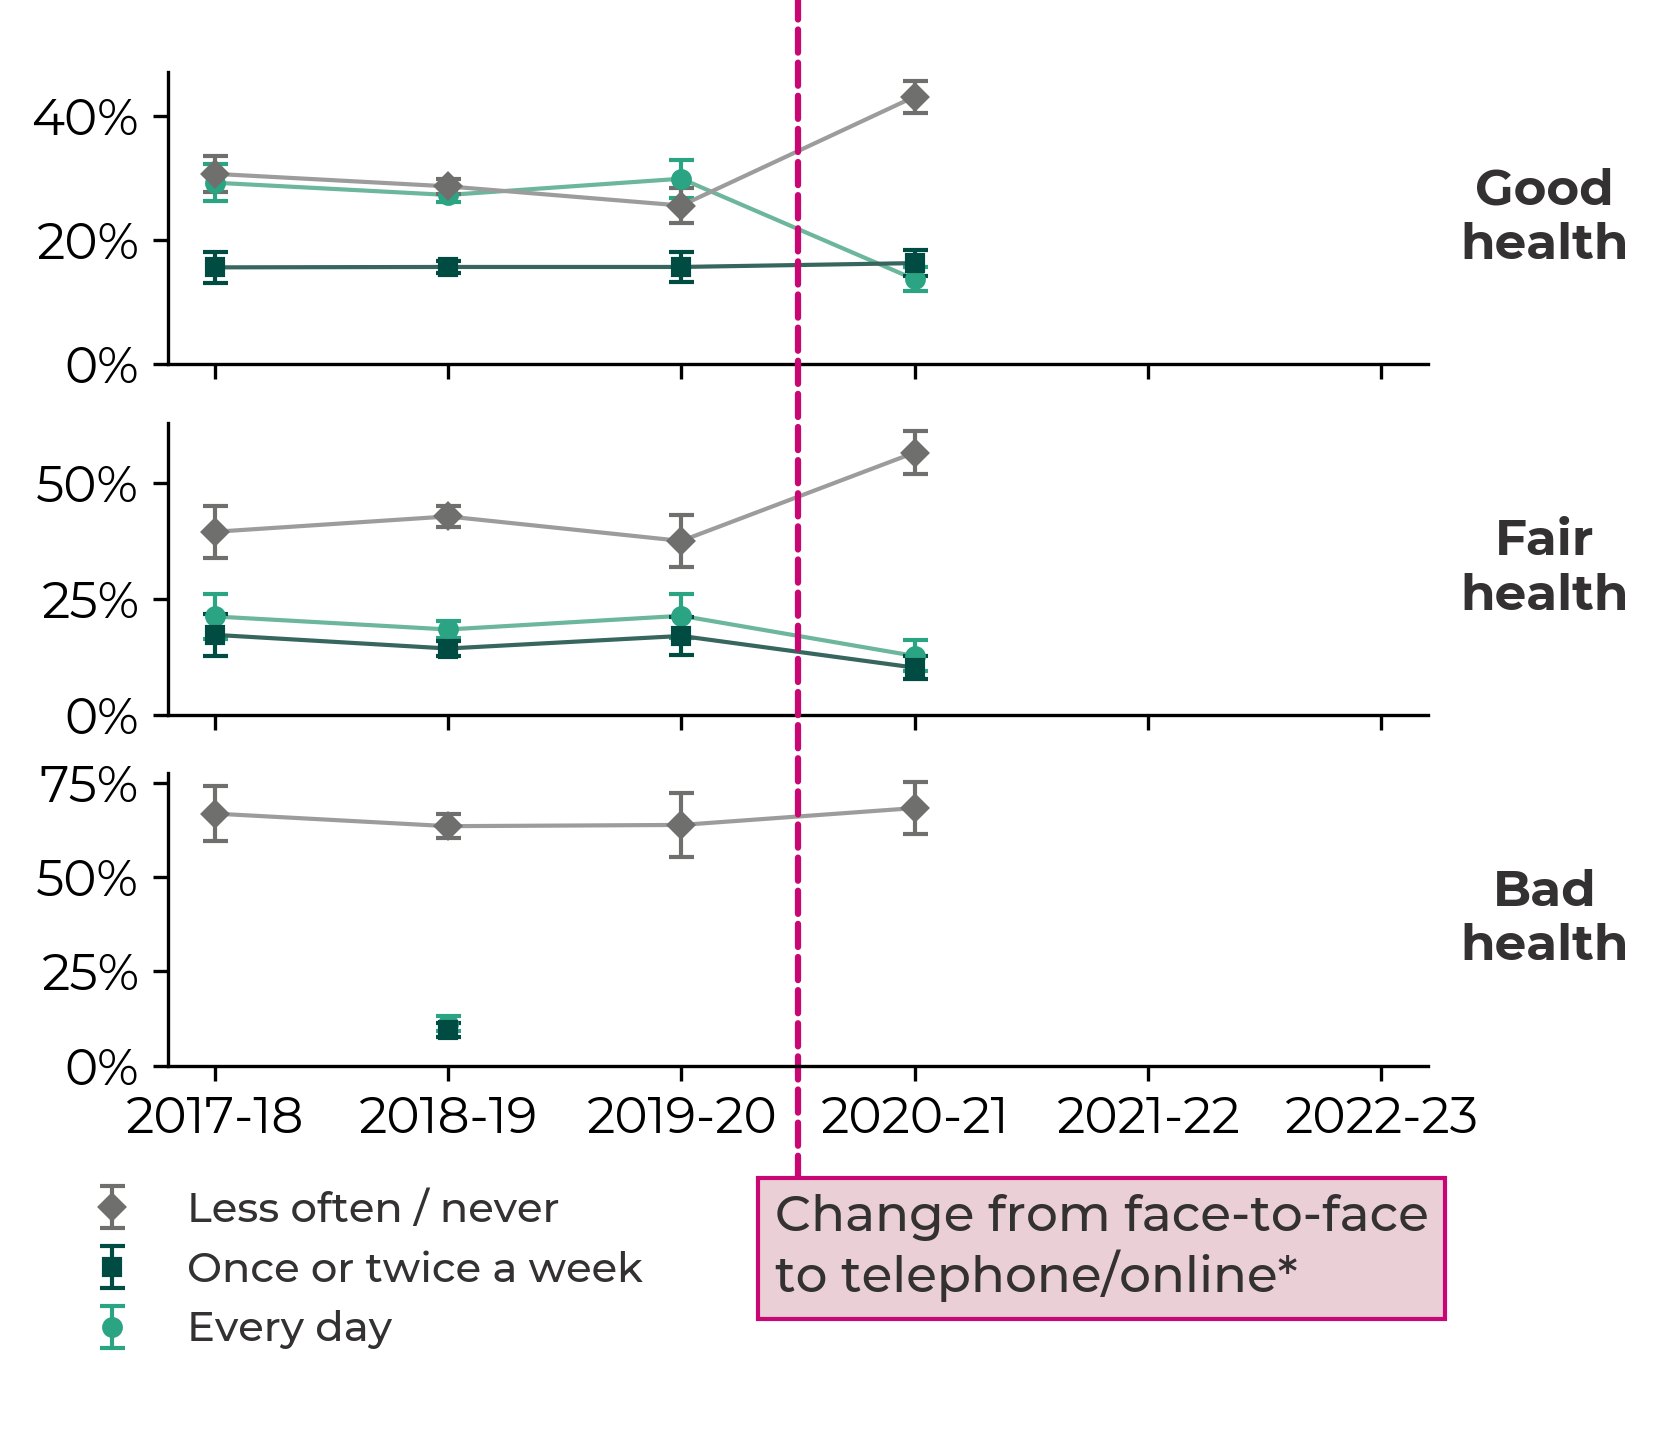
Has a limiting long-standing illness, disability or infirmity, 2021-22 to 2022-23
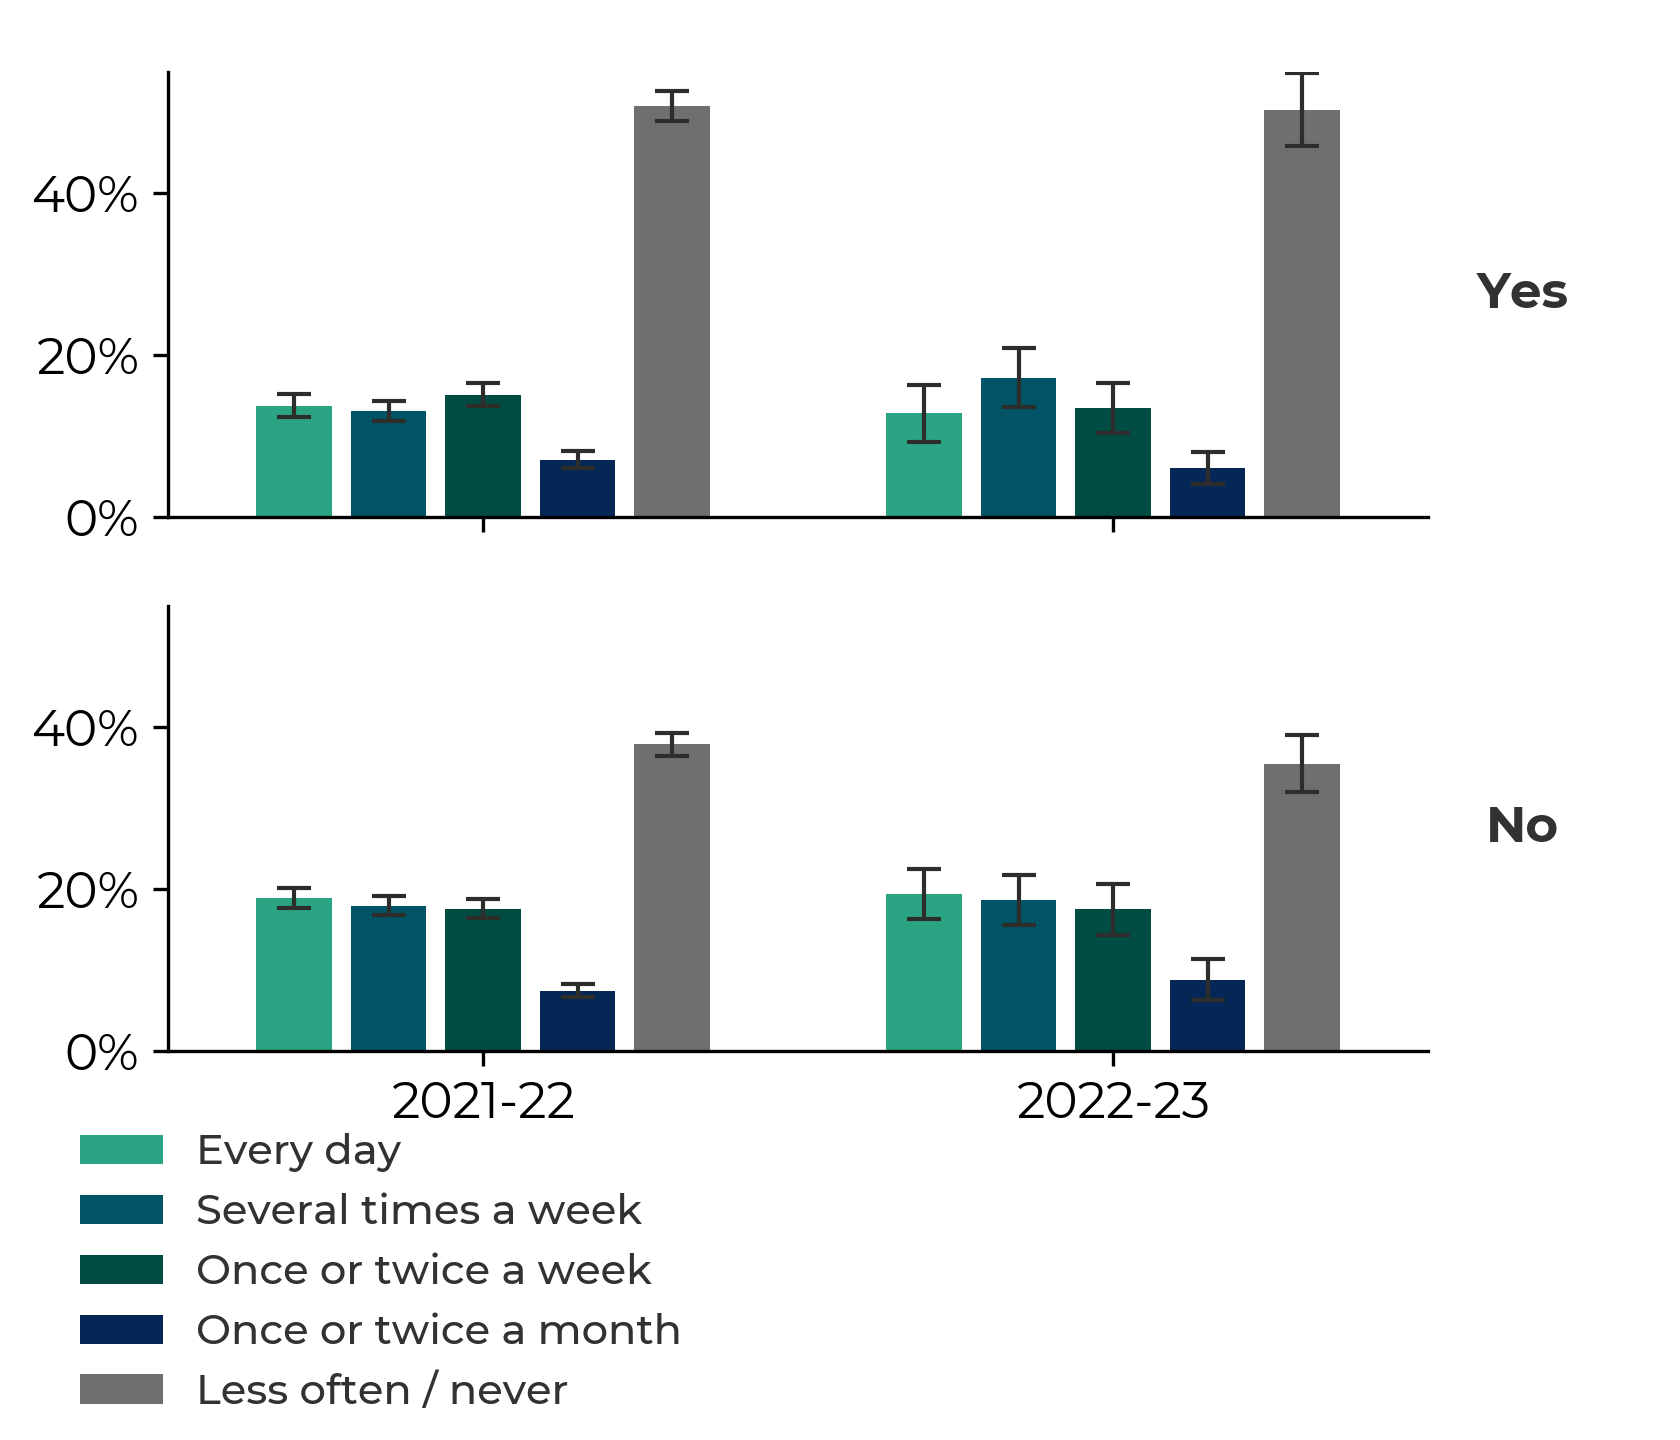
Household in material deprivation (FG indicator), 2017-18 to 2022-23
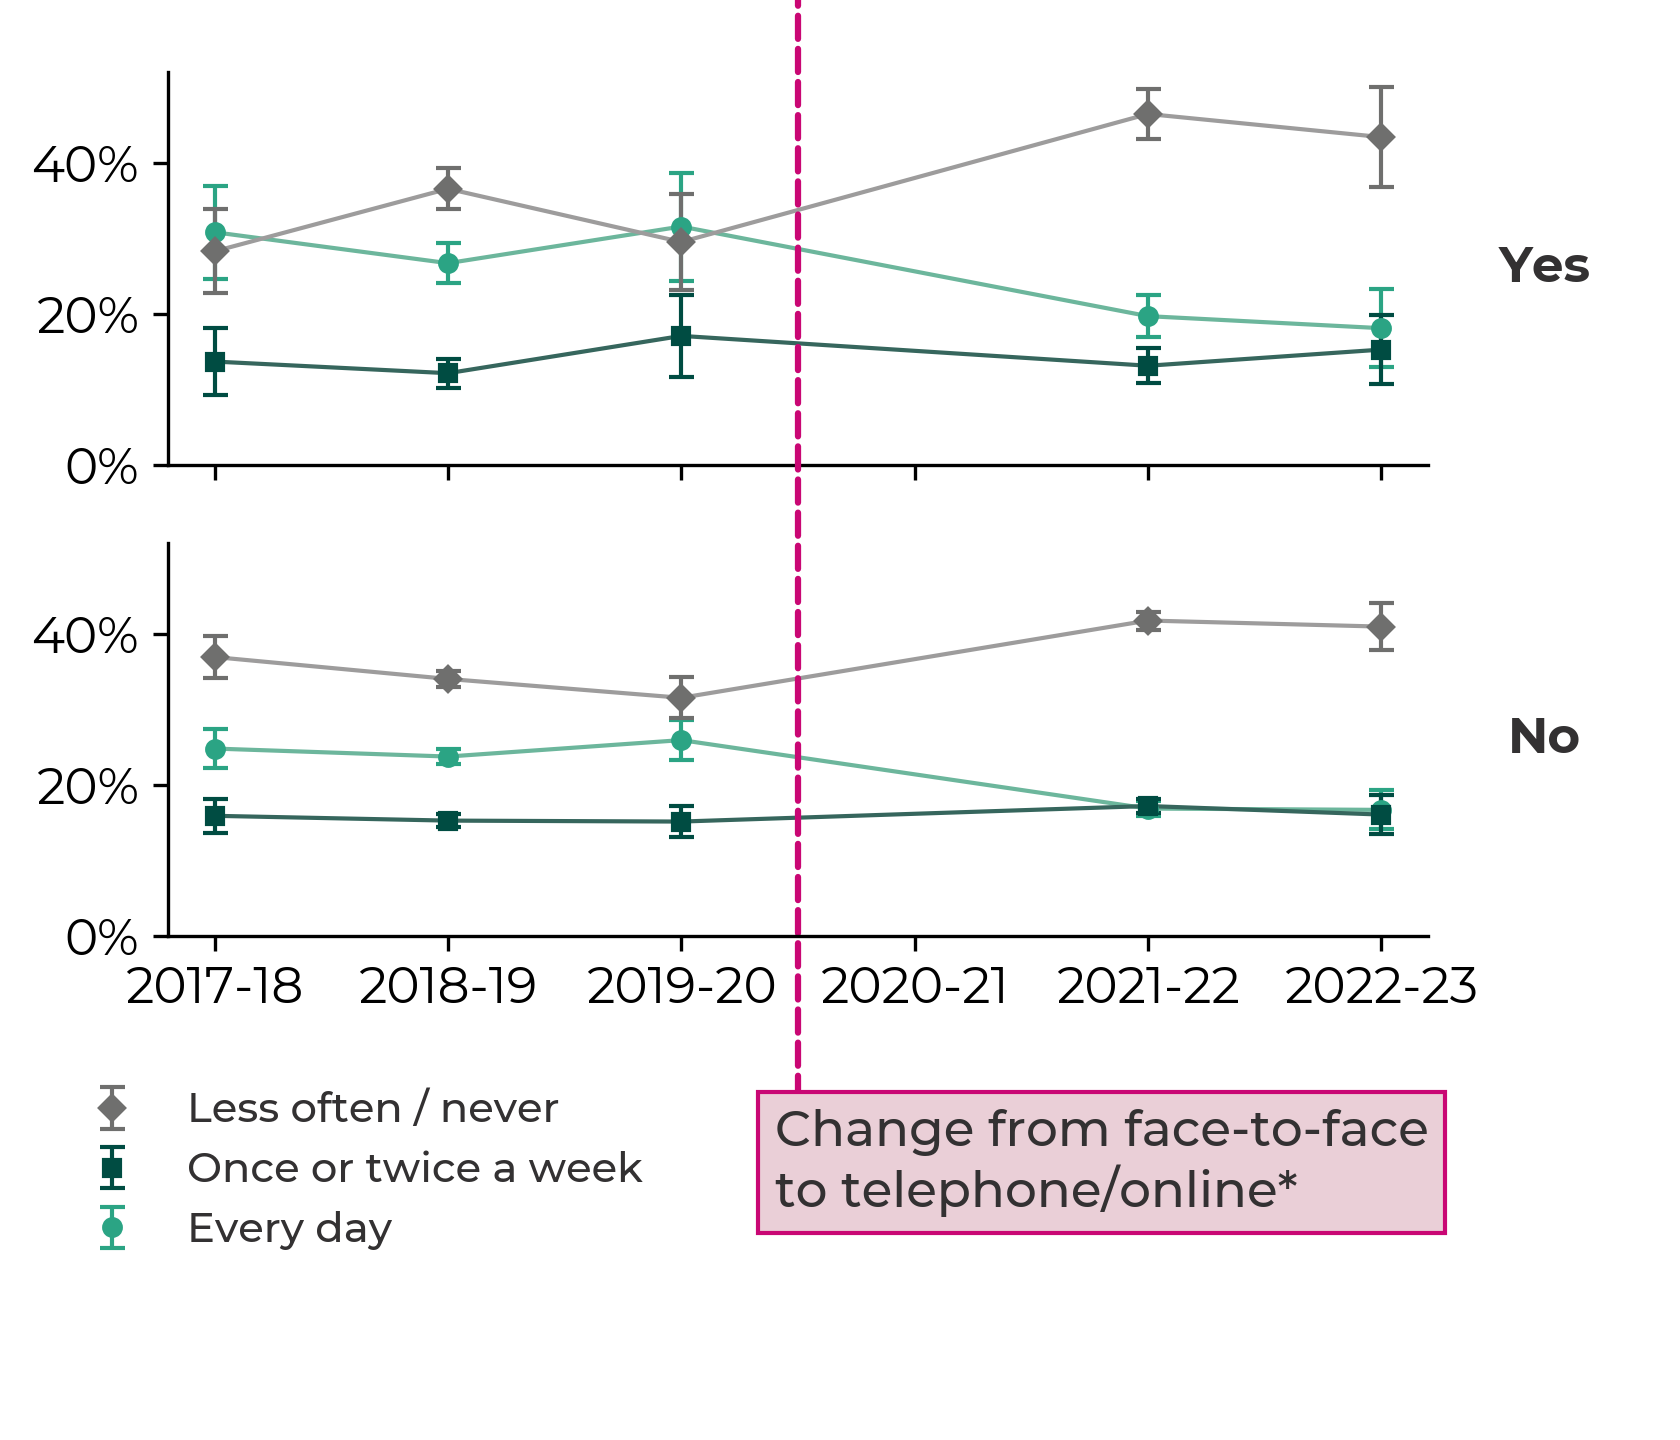
Rural/urban classification, 2017-18 to 2022-23
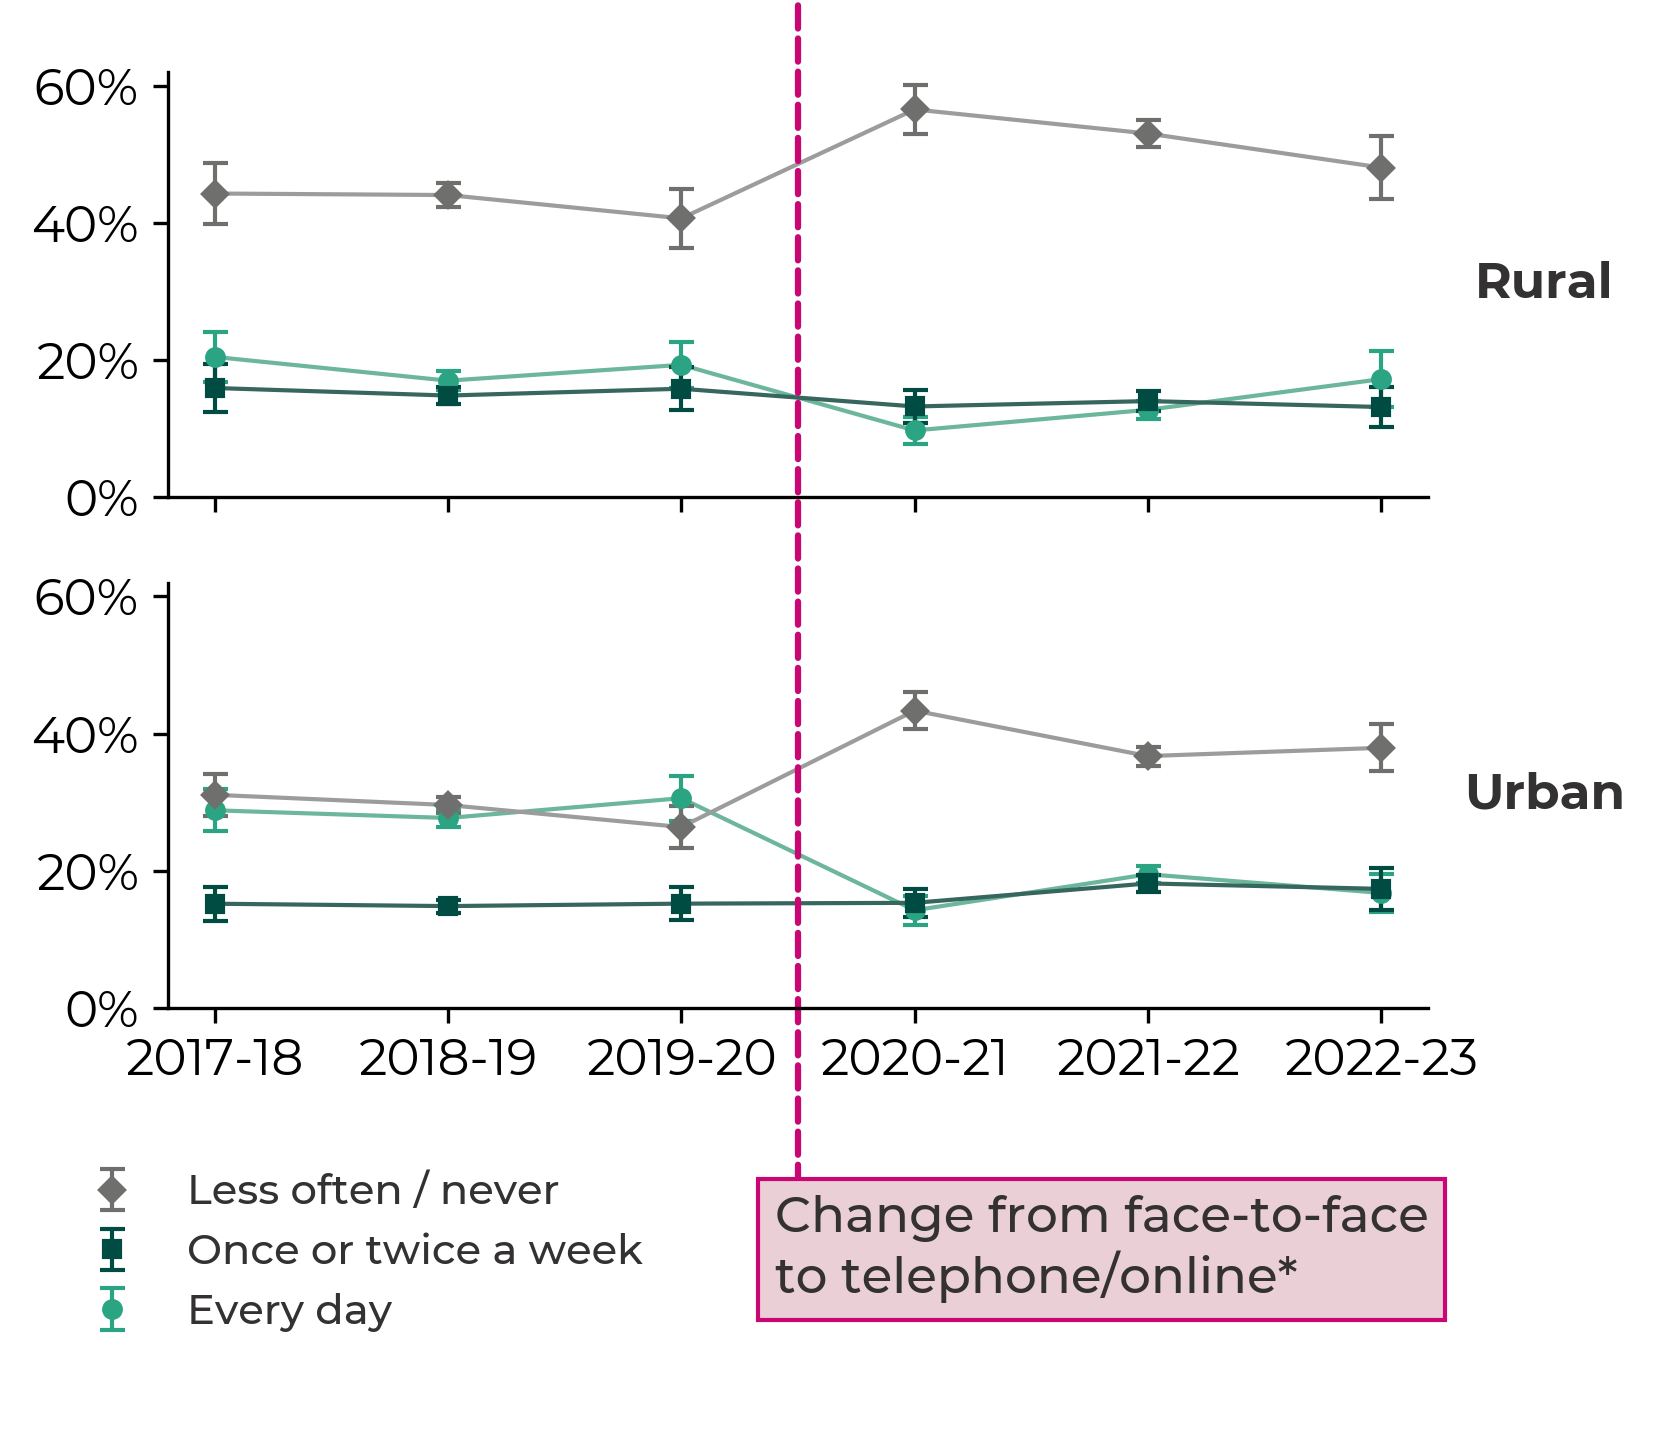
All respondents, 2018-19 to 2022-23
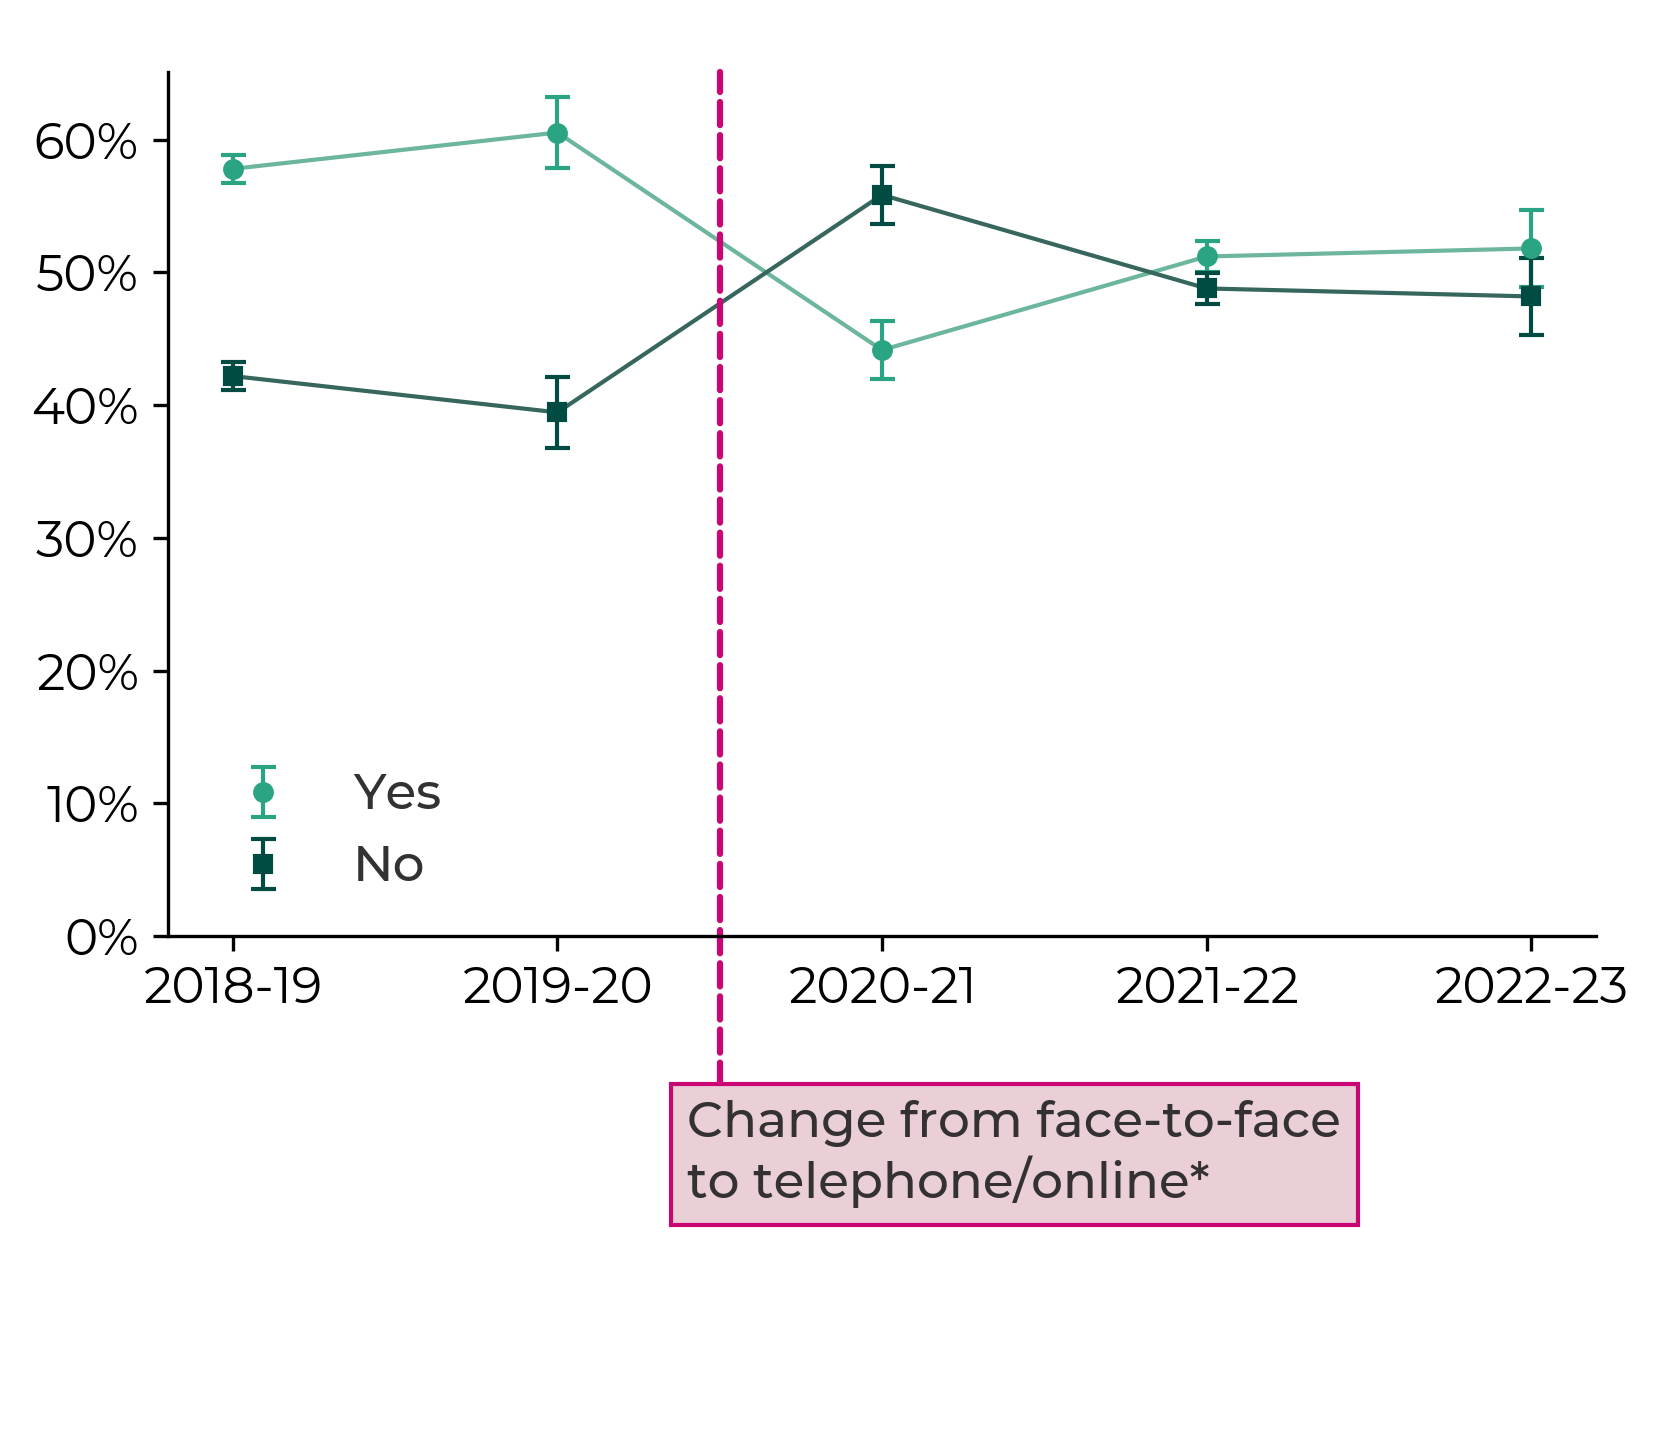
Sex, 2018-19 to 2022-23
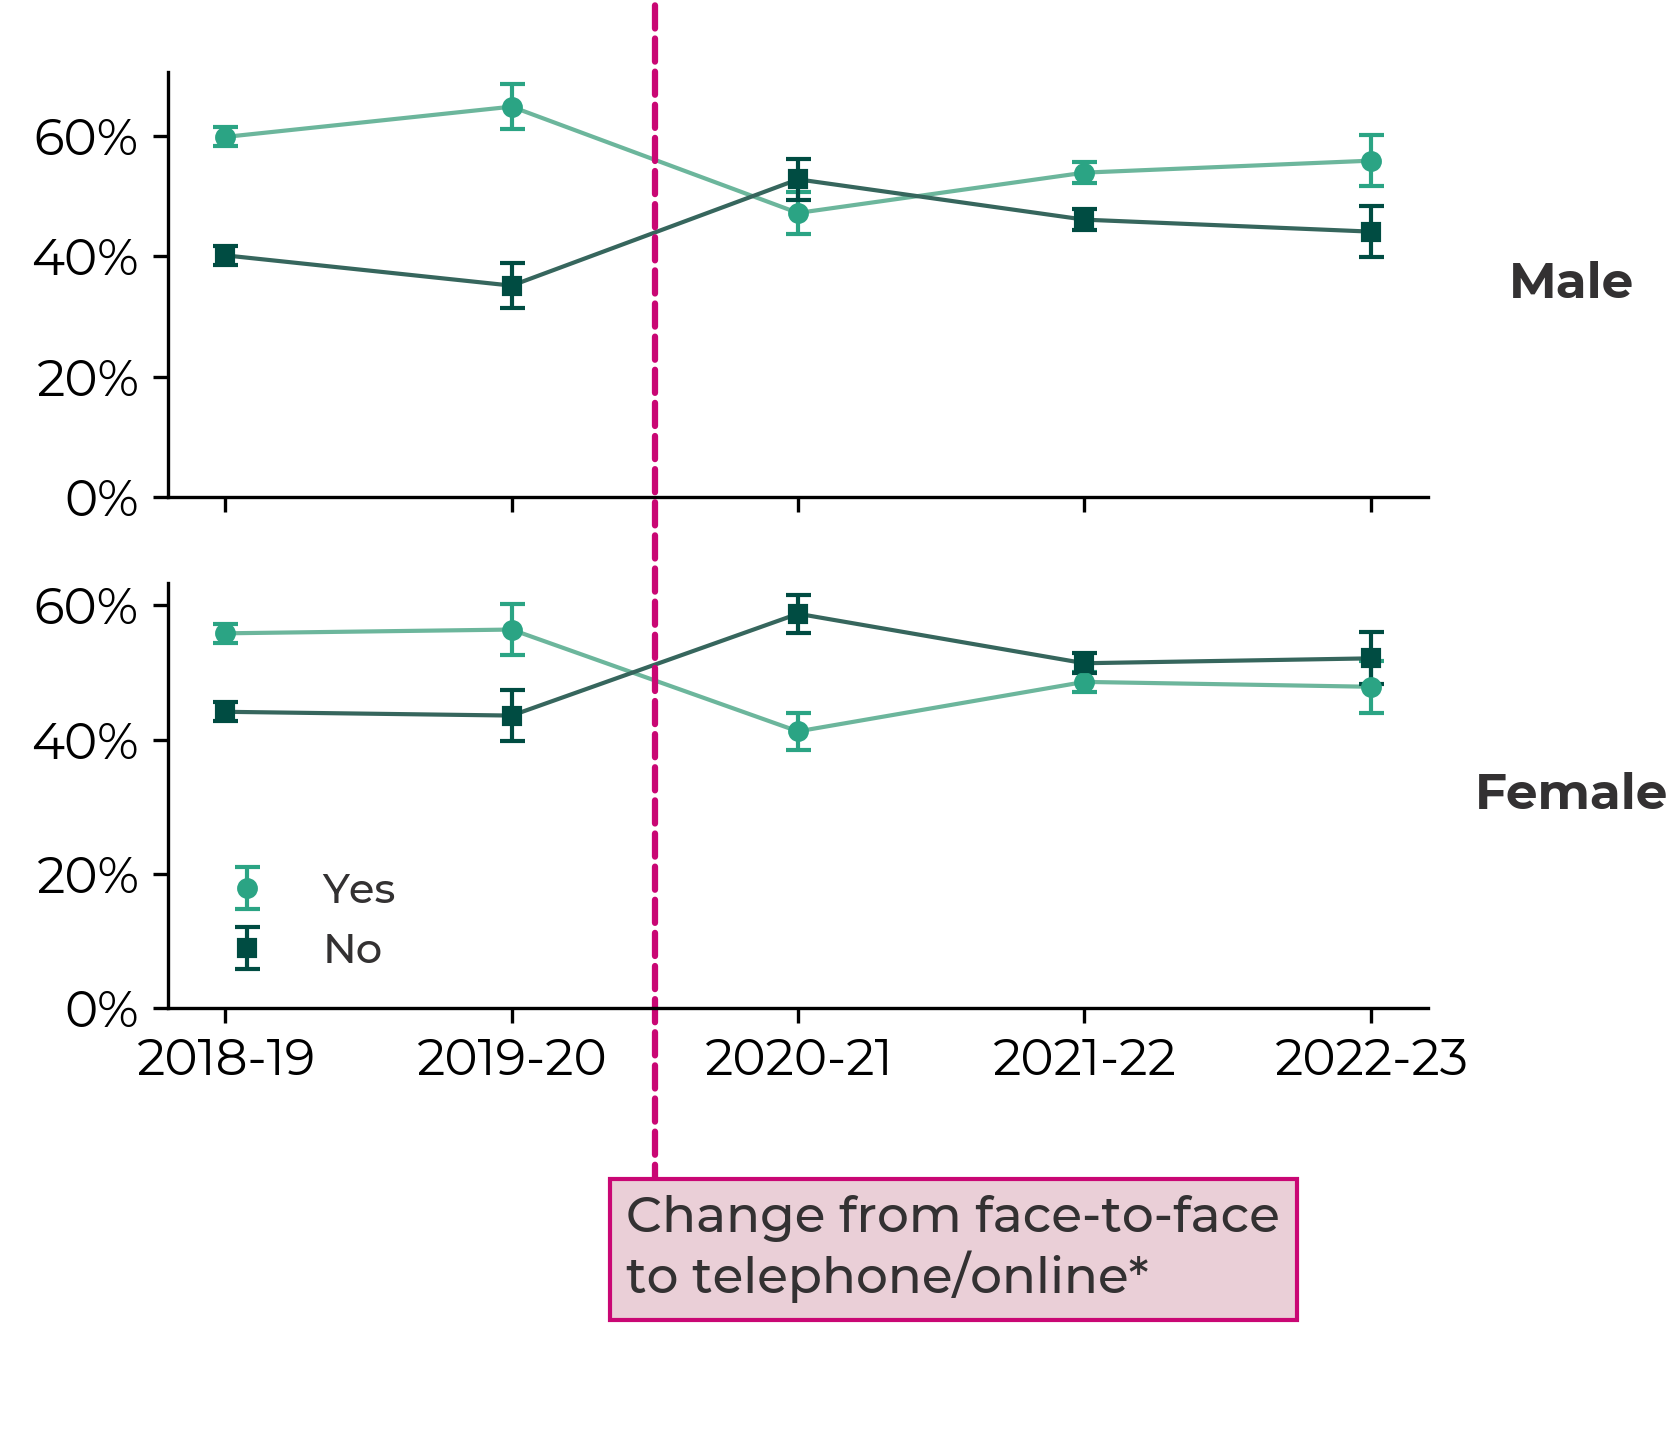
Rural/urban classification, 2018-19 to 2022-23
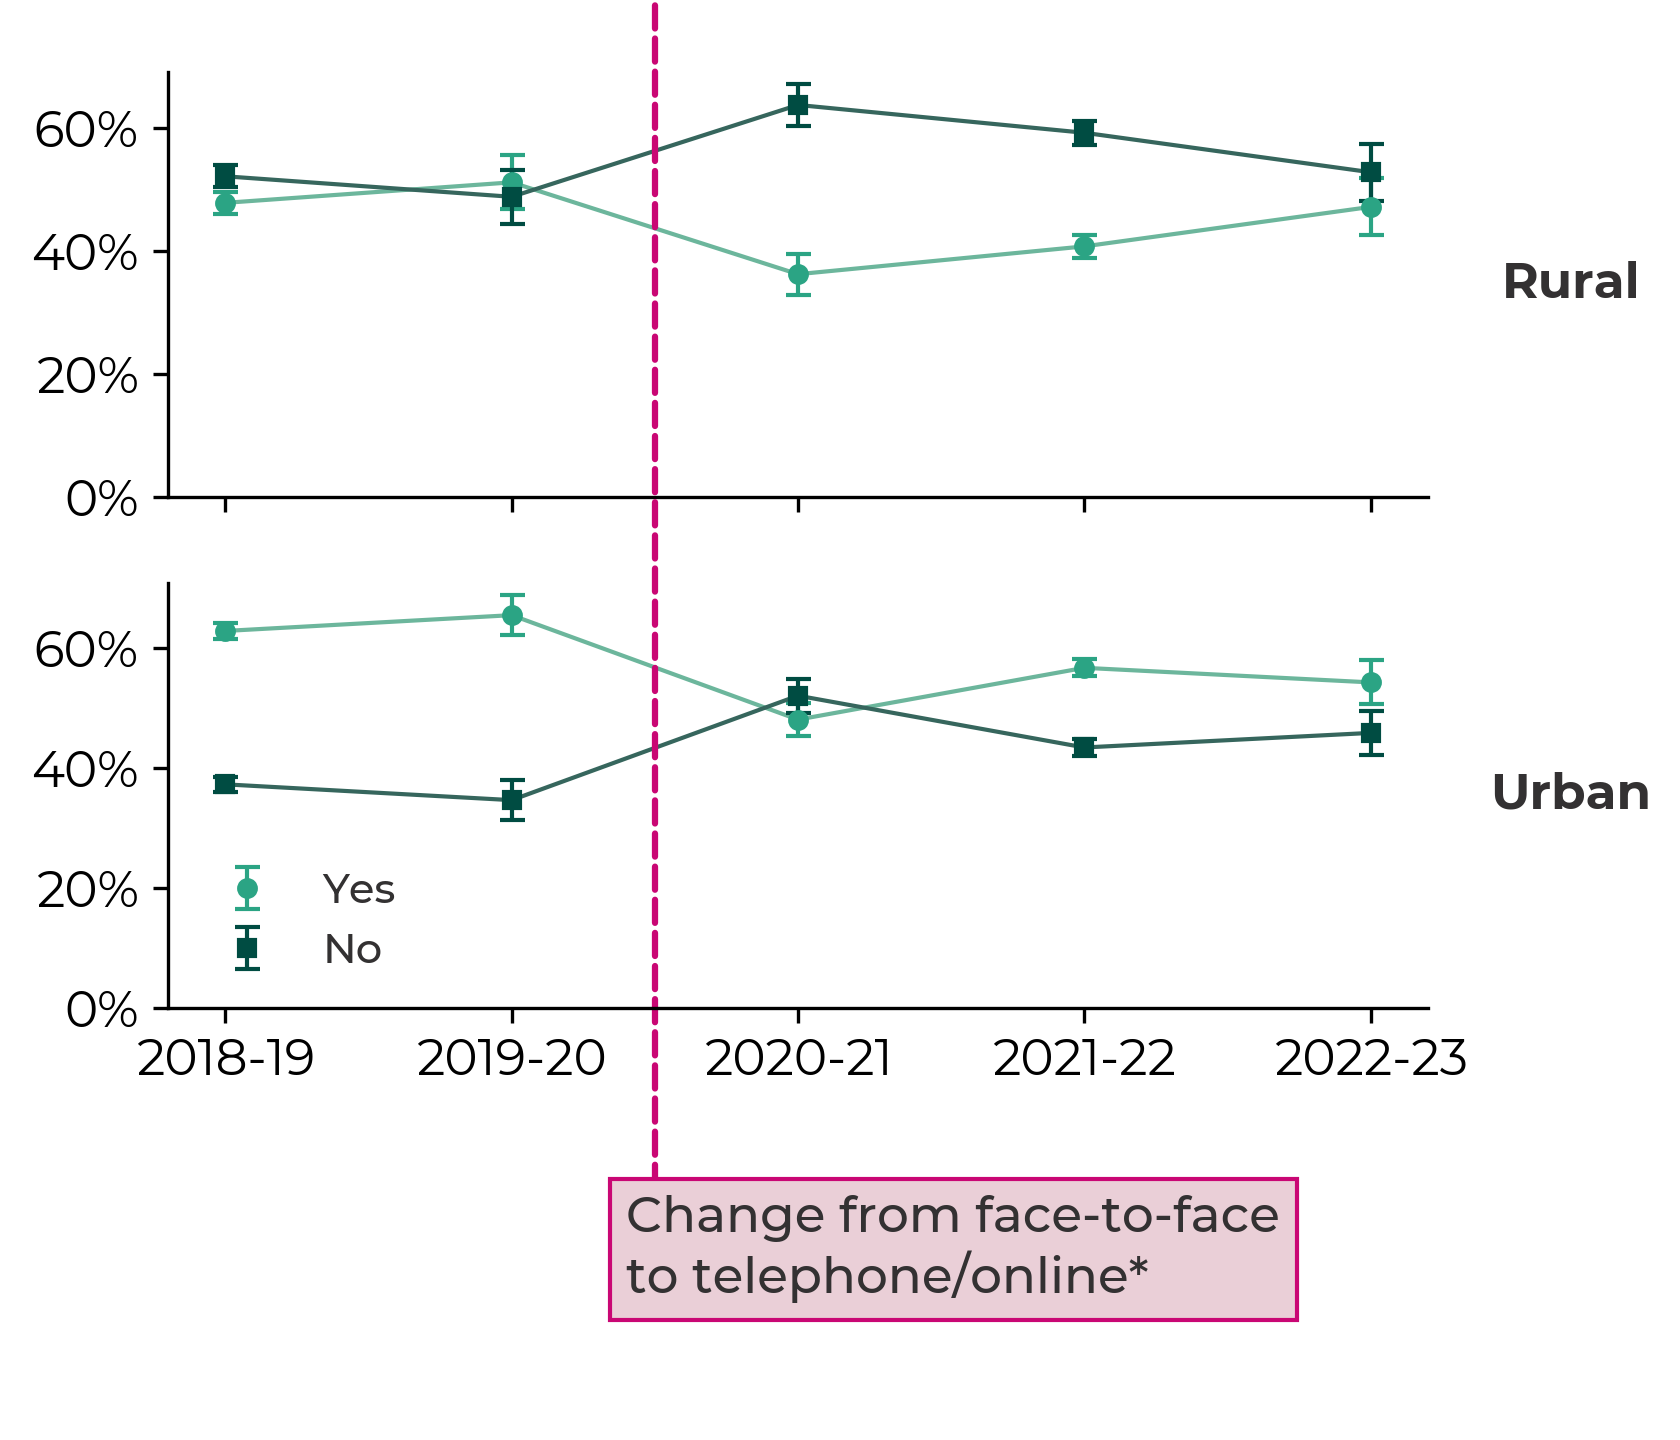
While it’s not possible to directly compare active travel rates between when the Act was passed and now, as data collection methods and sample sizes have changed, the data provides no evidence to suggest any significant increase in active travel since 2013.
What needs to change?
In 2022, the Senedd’s cross-party group on active travel ’s expert review panel (the panel) said the Act “has so much to offer Wales…but we have not realised its full potential”. It made 51 recommendations , including that the active travel board should be restructured, better monitoring was needed and that a national culture change campaign should take place.
It also highlighted a need to increase active travel to school. In its recent ‘Sustainable Ways’ report, the Welsh Youth Parliament’s Climate and Environment Committee found while there’s appetite amongst young people to walk or cycle more frequently than they currently do, “the infrastructure didn’t make this an appealing, safe, or convenient option”.
The panel’s main recommendation was for a new national delivery plan to be published by the end of 2022. The Deputy Minister has said a plan will be published shortly .
On funding, the panel acknowledged this had been a “significant area of progress in the last two years…due, in large part, to a major enhancement in the level of political will”. It’s fair to say recent Welsh Government transport policy – including its ambitious modal shift targets , roads review and default 20mph speed limits policy – points to a greater political focus on increasing active travel rates. On the latter, the Deputy Minister recently told the media , that along with reduced casualties, he was expecting to see an increase in levels of walking and cycling. He said “if we don't achieve those things then clearly the [20mph] policy will not have succeeded”.
The panel’s report suggested “at least some of the underperformance of the Act can be ascribed to weaknesses in its wording”. Attempts to address this have been made during scrutiny of the Environment (Air Quality and Soundscapes) (Wales) Bill . With the close links between air quality and active travel highlighted during stage 1 scrutiny , the Bill is seen as an opportunity to strengthen duties around promoting active travel.
Several amendments, including one Government amendment, were subsequently tabled during stage 2 proceedings . This included an amendment from Huw Irranca-Davies MS, Chair of the cross-party group that would have required the Welsh Government to publish guidance within 12 months of the Bill gaining Royal Assent. While Committee Members and the Deputy Minister decided not to move them to a vote, they agreed to “continue the constructive dialogue to try and reach something even better…at the next stage”.
It’s clear that ten years on, although the Act has been followed with increased public funding, it is yet to have a significant impact on active travel rates.
The Deputy Minister has said the Welsh Government is planning to “ramp up” spending in the “years to come” and that “a pretty deep reform to delivery mechanisms”, building on the panel’s report, is required.
Article by Francesca Howorth , Senedd Research, Welsh Parliament
Helpful links
- Subscribe to knowledge exchange updates chevron_right
- Get involved with the Senedd’s work chevron_right
- Subscribe to updates chevron_right

The latest on 20mph speed limits
- Research article
- Open access
- Published: 05 August 2017
Promoting active travel to school: a systematic review (2010–2016)
- Bo Pang 1 ,
- Krzysztof Kubacki 1 &
- Sharyn Rundle-Thiele 1
BMC Public Health volume 17 , Article number: 638 ( 2017 ) Cite this article
8056 Accesses
71 Citations
20 Altmetric
Metrics details
Interventions aiming to promote active school travel (AST) are being implemented globally to reverse AST decline. This systematic literature provides an update of AST interventions assessing study quality and theory use to examine progress in the field.
A systematic review was conducted to identify and analyse AST interventions published between 2010 and 2016. Seven databases were searched and exclusion criteria were applied to identify 18 AST interventions. Interventions were assessed using the Active Living by Design (ALBD) Community Action (5P) Model and the Evaluation of Public Health Practice Projects (EPHPP). Methods used to evaluate the effectiveness of each intervention and their outcomes and extent of theory use were examined.
Seven out of 18 studies reported theory use. The analysis of the interventions using the ALBD Community Action Model showed that Preparation and Promotion were used much more frequently than Policy and Physical projects. The methodological quality 14 out of 18 included interventions were assessed as weak according to the EPHPP framework.
Noted improvements were an increase in use of objective measures. Lack of theory, weak methodological design and a lack of reliable and valid measurement were observed. Given that change is evident when theory is used and when policy changes are included extended use of the ALBD model and socio-ecological frameworks are recommended in future.
Peer Review reports
Active school travel (AST) remains an important source of physical activity for children [ 1 ]. AST has been shown to provide benefits such as reduction in children’s Body Mass Index that long-term leads to a reduction in obesity-related diseases [ 2 ], improvement in academic performance at school [ 3 ], and as part of a larger picture, reduction in car use benefitting the environment [ 4 ]. Compared with other forms of physical activity, AST has the additional advantage of being convenient and free of monetary costs [ 5 ]. However, there is evidence that AST has significantly declined over the past 30 years [ 6 , 7 ]. Studies investigating the reasons behind the decline in AST point towards increasing use of car transportation, change in social norms [ 8 ], and parental concerns about safety (e.g. abduction, traffic, crime, and strangers) [ 9 ] as key contributors to the decline, amongst other factors.
Behavioural change interventions have attempted to reverse the decline in AST. For example, a systematic review by Chillon and colleagues [ 10 ] identified 13 interventions reporting a trivial to strong positive impact on AST behaviour. However, opportunities for improvement in future studies were identified including measurement, methodology and use of theory in intervention design and/or evaluation. A review update to consider progress in the field is timely to extend understanding.
Systematic literature reviews offer two key benefits. Firstly, systematic literature reviews guarantee that a more reliable knowledge base can be developed without biases that can occur in narrative reviews [ 11 , 12 ]. Secondly, systematic literature reviews can inform policy makers and practitioners by reporting the effectiveness of interventions [ 12 ]. Therefore, the purpose of the current study is three-fold. First, we aim to conduct a systematic literature review and analysis of AST interventions published between 2010 and 2016. Second, we compare the results of our review with Chillon et al. [ 10 ] to assess whether significant differences in theory use, measurement and design are evident between time periods. Third, we assess the extent of theory use for AST interventions reporting theory.
Data source and search strategy
This study followed Chillon et al. [ 10 ] search terms and systematic literature review procedures (see procedures outlined in13,14) to identify peer-reviewed journal articles reporting AST interventions published between 2010 and 2016. Seven databases (EBSCO All databases, Emerald, ProQuest All databases, Ovid All databases, ScienceDirect, Taylor & Francis, and Web of Science) were searched using the following terms:
active transport* OR active travel*
intervention* OR Randomi?ed Controlled Trial OR evaluation OR trial OR campaign* OR program* OR study OR studies
child* OR adolescent* OR parent* OR youth OR student* OR pupil*
The symbols ‘*’ and ‘?’ are used as wildcards to include possible plurals and American/British spelling versions of the relevant terms respectively. The search terms were determined by multiple experiments using different combinations of terms in database searches to maximize the likelihood of retrieving the most relevant results. The seven databases used in this review were selected as they include marketing- and health-oriented publications and these were consistent with databases reported in previous systematic literature reviews [ 13 , 14 ]. An additional file summarises the search strategy [see Additional file 1 ]. The numbers of articles retrieved from each database are shown in Table 1 below:
Exclusion criteria
A total of 1553 records were identified in the search. All records were downloaded and imported into EndNote. After removal of all duplicated records ( n = 696), 857 unique records were then checked against the following exclusion criteria to remove unqualified records:
not peer-reviewed journal articles, ensuring that all included sources had been peer-reviewed. Other types of records such as magazines, conference proceedings, newspapers, and dissertations were excluded;
not in English;
not related to AST;
policy related articles;
review/conceptual articles;
articles containing only formative research;
medical trials;
articles published before 2010.
After application of the exclusion criteria 27 qualified records remained. In the following stage backward and forward searches were conducted including examination of all reference lists of the 27 articles and searching authors’ names and websites, and intervention names in Google Scholar. A further 13 articles providing additional information about already identified AST interventions and one additional new intervention were identified. The process produced a total of 40 peer-reviewed articles published between 2010 and 2016 reporting a total of 18 AST interventions. PRISMA guidelines [ 15 ] were followed to systemically analyse the articles and report our review.
Figure 1 demonstrates the search process, and a full list of 40 papers for each intervention can be found in the Appendix .
The systematic review process
Data analysis
The following data was extracted and analysed from the papers:
Intervention strategy. In line with the method employed in Chillon et al.’s review [ 10 ], the Active Living by Design (ALBD) Community Action (5P) Model was adopted to analyse the strategies used in the interventions. This framework consists of five components: 1) Preparation, which includes “developing and maintaining a multidisciplinary community partnership, collecting relevant assessment data to inform program planning, providing relevant training, and pursuing financial and in-kind resources to build capacity” [ 16 ] (p. 315); 2) Promotion, which refers to engaging the target audience with dedicated messages and materials; 3) Program, which refers to ongoing organised activities that aim to engage individuals; 4) Policy, which refers to rules or standards that are set to regulate behaviours; and 5) Physical projects, which refer to environmental changes that are made to remove barriers to physical activity. Additionally, reported theory use was extracted and analysed as it has been linked to enhanced intervention outcomes [ 17 ], and theory use in AST interventions was previously found to be lacking [ 10 ]. The framework of assessing theory utilization was used in previous systematic reviews [ 18 , 19 ]. The framework consists of four levels, namely 1) Informed by theory, which means theory was identified but no or limited application of theoretical framework was used; 2) Applied theory, which means several components and measures were applied in the study; 3) Testing theory, which means more than half the theoretical constructs were explicitly measured and tested, or there exists theory comparison; 4) Building theory, which means revising or creating theory by measuring, testing, and analysing constructs.
Intervention design and delivery. The Evaluation of Public Health Practice Projects (EPHPP) [ 20 ] was adopted to assess the quality of the interventions and ensure consistency in reporting with earlier research [ 10 ]. EPHPP was developed to provide research evidence to support systematic intervention reviews by outlining step-by-step guidelines [ 21 ]. EPHPP has been used in a wide range of content areas, such as chronic disease prevention [ 22 ], family health [ 23 ], and substance abuse prevention [ 24 ]. EPHPP assesses six aspects of interventions: selection bias, study design, confounders, blinding, withdrawals and drop-outs, all of which is synthesised to calculate a global study rating. In EPHPP, each of the aspects are rated on a three-point scale, and the final global rating is based on the rating of the six aspects and identified as strong, moderate, or weak, based on the EPHPP guidelines [ 20 ].
Evaluation methods and outcomes. In contrast to the methods reported in Chillon et al. [ 10 ], who calculated the effect size for each intervention using Cohen’s d, in this study we only extracted the information about the methods used to evaluate the effectiveness of each intervention and their outcomes as reported in the papers. Although Cohen’s d could be an indicator of the effect size of the interventions, the identified heterogeneity of outcome measures among interventions makes the effect sizes incomparable with each other.
All data were extracted from the articles by two independent researchers and the final data were compared and verified to ensure accuracy. Discrepancies were minor and were resolved by discussion with a third researcher. In order to compare our results with Chillon et al.’s [ 10 ], we adopted the Fisher’s exact test to calculate the p value. Fisher’s exact test has been widely used to compare differences among small samples [ 13 ], and can offer more accurate results than the conventional Chi-Square method [ 25 ].
Intervention overview
Forty articles were identified in this review, covering 18 AST interventions. Full intervention details can be found in Table 2 .
All interventions were conducted in developed countries – including the United States ( N = 6) [ 26 , 27 , 28 , 29 , 30 , 31 ], Europe ( N = 6) (1 in Netherlands [ 32 ], 1 in Belgium [ 33 ], 1 in Norway [ 34 ], 1 in Sweden [ 35 ], 1 in Denmark [ 36 ], and 1 in the UK [ 37 ]), Australia ( N = 2) [ 7 , 38 ], New Zealand ( N = 2) [ 39 , 40 ], Canada ( N = 1) [ 41 ], and both the UK and Canada ( N = 1) [ 42 ]. All of the interventions targeted children. The aims of each intervention varied: 13 interventions aimed to promote AST only [ 7 , 26 , 27 , 28 , 29 , 30 , 31 , 33 , 36 , 37 , 40 , 41 , 42 ], and five interventions had multiple aims [ 32 , 34 , 35 , 38 , 39 ], including promoting healthy eating and physical activity, in which AST only served as one of the physical activity aims. Only three out of 18 interventions conducted pilot tests [ 31 , 37 , 41 ]. The intervention lengths varied from 4 weeks to 5 years, and the sample sizes varied from 58 to 57,096.
Intervention strategy and theory use
Chillon et al. [ 10 ] noted “the studies generally failed to describe their theoretical frameworks” (p. 8), however they did not report whether each of the studies reported or adopted theories. In our review, seven out of 18 interventions reported using theory. The most commonly used theory was Social Cognitive Theory reported ( n = 5) [ 29 , 30 , 34 , 39 , 42 ], followed by the Social Ecological Framework reported ( n = 2) [ 34 , 35 ] and the Theory of Planned Behaviour ( n = 2) [ 37 , 39 ]. Two interventions [ 34 , 39 ] reported using more than one theory. In terms of theory utilization level, there are two studies [ 29 , 39 ] informed by theory and two studies [ 35 , 42 ] which applied theory. For example, in the “Beat the Street” [ 42 ] intervention, the researchers introduced competition to win points if children walk to school, underpinning social cognitive theory and learning theory. Three studies [ 30 , 34 , 37 ] tested theory. For example, in the “Traveling Green” [ 37 ] intervention, the factors of the Theory of Planned Behaviour were measured and tested to explain active commuting. None of the studies built theory.
All interventions were analysed using the ALBD Community Action Model (see Table 3 ). Three interventions included all five strategies from the Community Action Model [ 36 , 40 , 41 ]. Five interventions included four strategies, three of which did not implement policy [ 7 , 27 , 29 ], and two did not implement physical projects [ 35 , 38 ]. Fisher’s exact tests were used to compare the strategies used in the Chillon et al. review [ 10 ] and our review and none of the 5Ps were significantly different.
Quality assessment
The quality assessment of identified interventions was next conducted using the EPHPP tool Footnote 1 (see Table 4 ). Two researchers independently assessed all relevant articles and only minor discrepancies were identified and later resolved by discussion with the third researcher. Fourteen studies were assessed as weak in the global rating. None were assessed as strong. Comparing with the results reported in Chillon et al. [ 10 ], in which all 14 included studies were assessed as weak, a minor improvement was observed with four studies in the current review evaluated as moderate [ 29 , 31 , 38 , 39 ].
None of the studies reported representative sampling methods, which resulted in weak scores in category A - selection bias. In terms of study design, three studies reported using randomised control trial design [ 30 , 32 , 34 ] and were therefore assessed as strong; 13 studies were assessed as moderate, with nine cohort analytic (two groups pre + post) [ 26 , 28 , 29 , 31 , 35 , 36 , 37 , 38 , 39 ], three cohort (one group pre + post) [ 7 , 41 , 42 ], and one interrupted time series design [ 33 ]. It is noteworthy that study [ 33 ] self-identified as quasi-experiment with pre- and post-tests, measuring effects during the intervention, therefore the study was classified as interrupted time series. Two studies were rated as weak, including one longitudinal study [ 40 ]. Although one study [ 27 ] self-identified as quasi-experimental design, no evaluation was reported and therefore the study was assessed as weak. In terms of confounders, six studies reported confounders and no major differences were found between groups, which resulted in a strong rating. The rest of the studies did not report accounting for confounders or had only one group in the design and were therefore assessed as weak.
None of the studies reported to be double blinded. Four studies were assessed as weak as neither assessors nor participants were blinded [ 7 , 33 , 35 , 42 ]. The rest of the studies were rated as moderate with either one-directional blinding or no relevant information reported. In terms of data collection methods, ten studies provided evidence of both reliability and validity and thus were assessed as strong [ 28 , 29 , 30 , 31 , 32 , 34 , 35 , 37 , 40 , 41 ]. Four were assessed as moderate with either reliability or validity being reported [ 27 , 33 , 38 , 39 ], and five were assessed as weak as they did not report reliability or validity [ 7 , 26 , 36 , 42 ]. Regarding the drop-out rate, seven studies were assessed as strong with more than 80% of participants completing the studies [ 7 , 29 , 30 , 32 , 33 , 35 , 36 ]. The remaining studies were assessed as moderate ( n = 4) [ 28 , 31 , 38 , 39 ] or weak ( n = 7) [ 26 , 27 , 34 , 37 , 40 , 41 , 42 ] due to either low completion rates or not providing enough withdrawal information.
Fisher’s exact tests were used to compare the EPHPP components between the Chillon et al. [ 10 ] review and our review.
Table 5 shows that apart from Data Collection Methods ( p = 0.011) none of the EPHPP components, including the global rating were significantly different.
Post-intervention evaluation and outcomes
A wide range of evaluation methods were reported in the 18 interventions identified in this review. They can be categorised into two main groups: self-reported and objective behavioural measures. Self-reported measures were identified in 14 interventions, and the most common methods included surveys ( n = 12) [ 7 , 27 , 28 , 29 , 30 , 33 , 36 , 37 , 38 , 40 , 41 , 42 ], interviews ( n = 2) [ 35 , 38 ], and diaries ( n = 1) [ 39 ]. Objective behavioural measures were identified in 12 interventions, and the most common methods included accelerometers, pedometer, and geographic information system (GIS) equipment ( n = 5) [ 27 , 31 , 34 , 37 , 39 ], BMI monitoring ( n = 5) [ 30 , 32 , 34 , 36 , 38 ], and observations ( n = 3) [ 26 , 28 , 30 ]. Eight studies combined self-reported and objective behavioural measures such as surveys and observations to triangulate and verify intervention effectiveness [ 27 , 28 , 30 , 36 , 37 , 38 , 39 , 42 ]. A comparison with Chillon et al. [ 10 ] indicates an increase in more objective assessment measures in recent years: in Chillon et al. [ 10 ], all studies used self-reported measurements and only three studies triangulated data including the addition of objective measurements.
All reported evaluation outcomes are summarised in Table 6 . Among 18 interventions, six interventions reported some positive effects on AST [ 26 , 27 , 29 , 38 , 40 , 42 ], two mixed effects on AST [ 7 , 41 ], and five reported no effect [ 32 , 35 , 36 , 37 , 39 ]. Five interventions did not measure AST behaviour [ 28 , 30 , 31 , 33 , 34 ] reporting other aims. Positive attitude change was reported in four interventions [ 30 , 33 , 34 , 41 ]; positive change in BMI was reported in two [ 32 , 38 ], positive policy change in two [ 33 , 35 ], knowledge and long-term infrastructure improvement were each reported in three interventions [ 7 , 29 , 41 ], and finally positive healthy eating and general physical activity changes were reported in one intervention each [ 30 , 32 ].
The purpose of this review was three-fold. First, we aimed to provide a contemporary review of AST interventions (2010-2016). Second, we aimed to compare the results of our review with Chillon et al. [ 10 ] to track progress in the field. Our review indicated that several issues identified by Chillon et al. [ 10 ] continue today and that theory use is limited in AST interventions. Third, we assessed theory utilization in AST interventions. We will focus our discussion on three key aspects, namely theoretical, methodological, and empirical.
Theoretical aspects
Previous research indicated that theory use in intervention design was associated with enhanced intervention outcomes [ 17 ], yet the extent of theory utilization had not been examined previously. In our review seven out of 18 studies reported theory use. Detailed examination identified that two were informed by theory, two applied theories, and three tested theories with examples highlighted in the results section. At the optimal level, theory should provide guidance on the constructs that become the strategic focus of a campaign. Moreover, the theory framework should be used to evaluate the intervention pre and post permitting comparisons of key theoretical constructs focussed upon to be made [ 43 ]. The importance of theory adoption and implementation in intervention design is advocated by many researchers [ 44 , 45 , 46 ]. Consistent with previous studies our results show that theory testing and building remains limited in AST. For example, Painter et al. [ 47 ], identified that 69.1% of health behaviour research used theory to inform a study, in 17.9% theories were applied, in 3.6% theories were tested, and only 9.4% of studies involved building/creating theory.
We propose three recommendations for future AST intervention implementation and reporting. Firstly, future studies should use theory to inform intervention development, execution and evaluation, and detail theory use to facilitate its full comparative assessment across multiple interventions. For example, Schuster et al. [ 48 ] used the Theory of Planned Behaviour to gain insights to inform an AST intervention. Results of the study indicated that four variables were found to be highly important in distinguishing carers segments, namely distance to school, current walk to/from school behaviour, subjective norms and intentions to increase their child’s walk to school behaviour. Given that theory can increase the effectiveness of interventions [ 19 , 47 ] extended application of theory in AST interventions is recommended. Research studies have been undertaken to systematically implement, assess, and report theory utilization in health promotion interventions, such as the UK MRC guidelines [ 49 , 50 ] and the four-step Theoretical Domains Framework [ 43 ], and these are recommended to guide future AST intervention design.
Secondly, the theories used in the interventions identified in our review, such as social ecological theory, social cognitive theory and the Theory of Planned Behaviour, have been considered traditionally as behaviour explanation theories [ 51 ]. However, as the ultimate purpose of AST interventions is to change behaviours, predictive theories and model testing should be deployed in future to develop theories focussed on behavioural change. Among all three studies in our review that tested theory [ 30 , 34 , 37 ], theoretical examination depended on cross-sectional regressions limiting understanding to explanation rather than causal understanding. AST interventions should embed predictive theory testing involving longitudinal design across multiple time points to simultaneously explore potential behavioural change determinants. This also requires researchers to focus on utilising more causal/predictive methods rather than variance-based explanation methods in future study design, which is consistent with calls to advance theory to examine behaviour change [ 52 ].
Social ecological theory, social cognitive theory and the Theory of Planned Behaviour were most frequently reported and this provides a rich avenue for future research. Lu et al. [ 53 ] notes that social ecological theory lacks sufficient specificity suggesting additional testing is needed [ 53 ] to establish reliable and valid measures. Individual focussed theories such as Theory of Planned Behaviour and social cognitive theory are limited overlooking structural factors (e.g. policy) which limits understanding of how behavioural change can be facilitated [ 54 ]. Therefore, we recommended that theories that were specifically developed in the AST context, such as the McMillan model [ 55 ] and the Ecological and Cognitive Active Commuting (ECAC) model [ 56 ], should be empirically explored in future AST interventions. For example, the ECAC model specifies three levels of determinants, namely policy, neighbourhood, and individual; that are correlated with AST, covering environmental, social, and psychological aspects providing a wider system view. The McMillan model has been shown to be effective among the general population [ 57 ] and young adolescents [ 58 ], whereas the ECAC model needs to be empirically tested.
Methodological aspects
The EPHPP framework was used in this review to assess methodological quality. Fourteen out of 18 studies were assessed as weak. Notably, selection biases, lack of double blinding, and not controlling for confounders were key issues identified in both the current and earlier review [ 10 ]. While selection biases arise from practical considerations [ 28 , 41 ] such as recruiting schools to participate in AST, making it difficult for researchers to control in all circumstances, the current study points to the need for large scale funding permitting optimal study design to be achieved. Issues such as controlling for confounders, on the other hand, can be implemented in most AST interventions. Use of statistical methods, such as case-matching sampling [ 59 ], MANCOVA [ 60 ], and multi-level modelling [ 61 ], are recommended for future AST interventions.
Due to the complexity and diversity of intervention aims, evaluation methods and outcome reporting, we were unable to make direct comparisons of effectiveness between reviews. Standardised outcome measures would permit comparisons and meta-analysis to deliver more detailed understanding in the future. In addition, we recommend that objective measurement methods should be carried out in future intervention design – especially given declining monetary cost of equipment (e.g. smart phones and wearable technology that can automatically capture data) [ 62 , 63 , 64 ]. Governments or other funding bodies need to call for more rigour in methodological design and measurement in future.
Empirical aspects
In line with the results reported in Chillon et al. [ 10 ], the current review confirmed the heterogeneity of included studies in terms of their length, sample size, and objectives (see Table 2 for details). However, analysis of the interventions indicated that significant room for improvement remains in terms of broader application of intervention activities. The analysis of the interventions using the ALBD Community Action Model showed that Preparation and Promotion were used much more frequently than Policy and Physical projects. Policy implementation and infrastructure improvements remained limited despite documented positive effects [ 27 , 29 ] indicating policy use may be a necessary condition for effectiveness [ 53 , 65 , 66 ]. Consistent with the theoretical utilization in AST, Physical programs seem to be effective in promoting AST (see for examples [ 29 , 31 ]). Our findings are consistent with Lu et al. [ 53 ]. In their systematic review, Lu et al. [ 53 ] found that social ecological theory is widely adopted and can explain factors preventing children’s walking to school. We recommend that intervention designers should incorporate more school and local policies and infrastructural improvement such as crime prevention and traffic control in order to reduce the perceived risk of AST among parents, observed in many previous reviews [ 67 , 68 ]. Moreover, habit was not identified as a behavioural determinant in any of included studies although transport habit is an important factor in AST [ 69 ]. Future intervention designs should consider facilitating long-term support to convert occasional AST behaviour to a habitual behaviour.
Many of the studies embedded compulsory educational workshops and informational sessions into curriculum (e.g., [ 32 , 39 , 40 ]). Evidence shows that curricular-based interventions results in low attendance and are less effective, which may explain drop-out rates observed for studies employing educational workshops and informational sessions [ 70 ]. Therefore, we recommend that instead of educating schools, parents, and children using traditional curricular-based strategies, approaches with more audience engagement be adopted. For example, gamification has been drawing increased attention from intervention designers in recent years, and programs such as GOKA [ 71 ] and ONESELF [ 72 ] have been shown to achieve substantial audience engagement while delivering outcome effects. Future research should test gamification within AST interventions to extend understanding.
Limitations
This review has several important limitations, many of which represent opportunities for future research. The search parameters used in the current review limit the studies identified. For example, grey literature and studies not in the English literature were not included in this review. Further, all of the 18 interventions were carried out in developed countries, yet physical inactivity among children is a significant challenge in many developing countries [ 73 ] suggesting there is an opportunity to extend AST intervention testing geographically.
A range of outcome measures and methods (self-report and non-self-report) were used to assess AST interventions including attitudes, policy, physical activity, active school travel, BMI, knowledge and infrastructure. The diversity of outcome measures prevents meta-analysis from being undertaken. Different evaluation methods limit potential comparisons between interventions. Further, given physical activity self-report data varies when compared to objective measures (non-self-report) despite high correlations with objective forms such as pedometers and diaries [ 74 ], biases must be acknowledged [ 75 ]. Moving forward, a unified and consistent approach in reporting AST intervention outcomes is needed to enable meta-analysis to be undertaken in future. Standardisation of outcome reporting would permit effect sizes to be calculated enabling comparison between interventions. Future research is recommended to determine whether there is a relationship between EPHPP quality levels and effect size – an understanding that would inform AST practice.
Meanwhile, the analysis presented in this paper is also limited to the information reported in sources identified in the search process. Employment of a standard reporting framework for AST intervention reporting warrants future research attention ensuring that quality assessments take practicalities into account. For example, full blinding procedures such as those advocated in EPHPP may not be feasible in local government and State funded interventions thereby making this assessment component redundant. Such endeavours may assist to standardise reporting and in turn enhance quality assessment exercises informing future intervention development.
This review has provided a detailed analysis of AST interventions published in peer-reviewed journals between 2010 and 2016. Following systematic literature review procedures’ 18 AST interventions were identified and subsequently analysed. The main findings of our study are:
Theory utilization in AST interventions published between 2010 and 2016 is limited. Where theory is used, interventions informed by theory and interventions that apply theory are much more common than theory testing and building.
Considering the ALBD Community Action Model, Preparation and Promotion were reportedly used much more frequently than Policy and Physical projects. Given that change is evident where policy changes are made extended use of the ALBD model is recommended (Preparation, Promotion, Program, Policy and Physical projects).
Using the EPHPP framework, 14 out of 18 interventions were weak, largely due to selection biases, lack of double blinding, and not controlling for confounders.
Finally, an increase in more objective assessment measures in AST interventions published between 2011 and 2016 was observed, in comparison to the rates reported in Chillon et al. [ 10 ].
Issues such as weak methodological design and lack of reliable and valid measurements continue to persist in reported AST interventions, all of which indicate opportunities for further improvements in terms of intervention effectiveness and evaluation.
It is noteworthy that six interventions have multiple published papers. As the EPHPP was designed to assess studies rather than interventions [ 20 ], and in order to minimise the discrepancies between papers reporting different components of interventions, only one paper reporting information relevant to the EPHPP framework was selected for each intervention. Excluded papers did not provide any information that would affect the EPHPP rating of the study. The papers used in the EPHPP assessment are marked in the Appendix .
Abbreviations
Active Living by Design
Active School Travel
Body mass index
Ecological and Cognitive Active Commuting
Effective Public Health Practice Project
Health eating
- Physical activity
Faulkner GE, Buliung RN, Flora PK, Fusco C. Active school transport, physical activity levels and body weight of children and youth: a systematic review. Prev Med. 2009;48(1):3–8.
Article PubMed Google Scholar
Dollman J, Lewis NR. Active transport to school as part of a broader habit of walking and cycling among south Australian youth. Pediatr Exerc Sci. 2007;19(4):436.
Dwyer T, Sallis JF, Blizzard L, Lazarus R, Dean K. Relation of academic performance to physical activity and fitness in children. Pediatr Exerc Sci. 2001;13(3):225–37.
Article Google Scholar
Moodie M, Haby MM, Swinburn B, Carter R. Assessing cost-effectiveness in obesity: active transport program for primary school children—TravelSMART schools curriculum program. J Phys Act Health. 2011;8(4):503–15.
Rosenberg DE, Sallis JF, Conway TL, Cain KL, McKenzie TL. Active transportation to school over 2 years in relation to weight status and physical activity. Obesity. 2006;14(10):1771–6.
Mammen G, Stone MR, Faulkner G, Ramanathan S, Buliung R, O’Brien C, Kennedy J. Active school travel: an evaluation of the Canadian school travel planning intervention. Prev Med. 2014;60:55–9.
Crawford S, Garrard J. A combined impact-process evaluation of a program promoting active transport to school: understanding the factors that shaped program effectiveness. J Environ Public Health. 2013. Article ID 816961. 14 pages.
Newman P, Kenworthy J. Sustainability and cities: overcoming automobile dependence. Washington DC: Island Press; 1999.
DiGuiseppi C, Roberts I, Li L, Allen D. Determinants of car travel on daily journeys to school: cross sectional survey of primary school children. BMJ. 1998;316(7142):1426–8.
Article CAS PubMed PubMed Central Google Scholar
Chillón P, Evenson KR, Vaughn A, Ward DS. A systematic review of interventions for promoting active transportation to school. Int J Behav Nutr Phys Act. 2011;8(1):1.
Tranfield D, Denyer D, Smart P. Towards a methodology for developing evidence-informed management knowledge by means of systematic review. Br J Manag. 2003;14(3):207–22.
Petticrew M, Roberts H. Systematic reviews in the social sciences: a practical guide. Malden: Blackwell Publishing Ltd; 2008.
Carins JE, Rundle-Thiele SR. Eating for the better: a social marketing review (2000–2012). Public Health Nutr. 2014;17(7):1628–39.
Kubacki K, Rundle-Thiele S, Pang B, Buyucek N. Minimizing alcohol harm: a systematic social marketing review (2000–2014). J Bus Res. 2015;68(10):2214–22.
PRISMA Statement. http://www.prisma-statement.org/ . Accessed 14 Dec 2016.
Bors P, Dessauer M, Bell R, Wilkerson R, Lee J, Strunk SL. The active living by design national program: community initiatives and lessons learned. Am J Prev Med. 2009;37(6):S313–21.
Thackeray R, Neiger BL. Establishing a relationship between behavior change theory and social marketing: implications for health education. J Health Educ. 2000;31(6):331–5.
Webb T, Joseph J, Yardley L, Michie S. Using the internet to promote health behavior change: a systematic review and meta-analysis of the impact of theoretical basis, use of behavior change techniques, and mode of delivery on efficacy. J Med Internet Res. 2010;12(1):e4.
Article PubMed PubMed Central Google Scholar
Glanz K, Bishop DB. The role of behavioral science theory in development and implementation of public health interventions. Annu Rev Public Health. 2010;31:399–418.
Effective Public Health Practice Project: Quality assessment Tool for Quantitative Studies. http://www.ephpp.ca/tools.html . Accessed 14 Dec 2016.
Thomas B, Ciliska D, Dobbins M, Micucci S. A process for systematically reviewing the literature: providing the research evidence for public health nursing interventions. Worldviews Evid-Based Nurs. 2004;1(3):176–84.
Article CAS PubMed Google Scholar
Ganann R, Fitzpatrick-Lewis D, Ciliska D, Peirson L. Community-based interventions for enhancing access to or consumption of fruit and vegetables among five to 18-year olds: a scoping review. BMC Public Health. 2012;12(1):1.
Peirson L, Fitzpatrick-Lewis D, Morrison K, Warren R, Ali MU, Raina P. Treatment of overweight and obesity in children and youth: a systematic review and meta-analysis. CMAJ open. 2015;3(1):E35–46.
Bryden A, Roberts B, McKee M, Petticrew M. A systematic review of the influence on alcohol use of community level availability and marketing of alcohol. Health Place. 2012;18(2):349–57.
Larntz K. Small-sample comparisons of exact levels for chi-squared goodness-of-fit statistics. J Am Stat Assoc. 1978;73(362):253–63.
Bungum TJ, Clark S, Aguilar B. The effect of an active transport to school intervention at a suburban elementary school. Am J Health Educ. 2014;45(4):205–9.
McDonald NC, Yang Y, Abbott SM, Bullock AN. Impact of the safe routes to school program on walking and biking: Eugene, Oregon study. Transp Policy. 2013;29:243–8.
Heinrich KM, Dierenfield L, Alexander DA, Prose M, Peterson AC. Hawai ‘i's opportunity for active living advancement (HO ‘ĀLA): addressing childhood obesity through safe routes to school. Hawaii Med J. 2011;70(7 suppl 1):21.
PubMed PubMed Central Google Scholar
Hoelscher D, Ory M, Dowdy D, Miao J, Atteberry H, Nichols D, Evans A, Menendez T, Lee C, Wang S. Effects of funding allocation for safe routes to school programs on active commuting to school and related behavioral, knowledge, and psychosocial outcomes results from the Texas childhood obesity prevention policy evaluation (T-COPPE) study. Environ Behav. 2016;48(1):210–29.
Mendoza JA, Watson K, Baranowski T, Nicklas TA, Uscanga DK, Hanfling MJ. The walking school bus and children's physical activity: a pilot cluster randomized controlled trial. Pediatrics. 2011;128(3):e537–44.
Sayers SP, LeMaster JW, Thomas IM, Petroski GF, Ge B. A walking school bus program: impact on physical activity in elementary school children in Columbia, Missouri American. J Prev Med. 2012;43(5):S384–9.
van Nassau F, Singh AS, van Mechelen W, Paulussen TG, Brug J, Chinapaw MJ. Exploring facilitating factors and barriers to the nationwide dissemination of a Dutch school-based obesity prevention program “DOiT”: a study protocol. BMC Public Health. 2013;13(1):1.
Vanwolleghem G, D’Haese S, Van Dyck D, De Bourdeaudhuij I, Cardon G. Feasibility and effectiveness of drop-off spots to promote walking to school. Int J Behav Nutr Phys Act. 2014;11(1):1.
Lien N, Bjelland M, Bergh IH, Grydeland M, Anderssen SA, Ommundsen Y, Andersen LF, Henriksen HB, Randby J, Klepp K-I. Design of a 20-month comprehensive, multicomponent school-based randomised trial to promote healthy weight development among 11-13 year olds: the HEalth in adolescents study. Scand J Public Health. 2010;38(5 suppl):38–51.
Elinder LS, Heinemans N, Hagberg J, Quetel A-K, Hagströmer M. A participatory and capacity-building approach to healthy eating and physical activity–SCIP-school: a 2-year controlled trial. Int J Behav Nutr Phys Act. 2012;9(1):1.
Østergaard L, Støckel JT, Andersen LB. Effectiveness and implementation of interventions to increase commuter cycling to school: a quasi-experimental study. BMC Public Health. 2015;15(1):1.
McMinn D, Rowe DA, Murtagh S, Nelson NM. The effect of a school-based active commuting intervention on children's commuting physical activity and daily physical activity. Prev Med. 2012;54(5):316–8.
Mathews LB, Moodie MM, Simmons AM, Swinburn BA. The process evaluation of It's your move!, an Australian adolescent community-based obesity prevention project. BMC Public Health. 2010;10(1):1.
Duncan S, McPhee JC, Schluter PJ, Zinn C, Smith R, Schofield G. Efficacy of a compulsory homework programme for increasing physical activity and healthy eating in children: the healthy homework pilot study. Int J Behav Nutr Phys Act. 2011;8(1):1.
Hinckson EA, Garrett N, Duncan S. Active commuting to school in New Zealand children (2004-2008): a quantitative analysis. Prev Med. 2011;52(5):332–6.
Buliung R, Faulkner G, Beesley T, Kennedy J. School travel planning: mobilizing school and community resources to encourage active school transportation. J Sch Health. 2011;81(11):704–12.
Hunter RF, de Silva D, Reynolds V, Bird W, Fox KR. International inter-school competition to encourage children to walk to school: a mixed methods feasibility study. BMC Res Notes. 2015;8(1):1.
French SD, Green SE, O’Connor DA, McKenzie JE, Francis JJ, Michie S, Buchbinder R, Schattner P, Spike N, Grimshaw JM. Developing theory-informed behaviour change interventions to implement evidence into practice: a systematic approach using the theoretical domains framework. Implement Sci. 2012;7(1):1.
Des Jarlais DC, Lyles C, Crepaz N. Improving the reporting quality of nonrandomized evaluations of behavioral and public health interventions: the TREND statement. Am J Public Health. 2004;94(3):361–6.
Baker EA, Brennan Ramirez LK, Claus JM, Land G. Translating and disseminating research- and practice-based criteria to support evidence-based intervention planning. J Public Health Manag Pract. 2008;14(2):124–30.
Boutron I, Moher D, Altman DG, Schulz KF, Ravaud P. Extending the CONSORT statement to randomized trials of nonpharmacologic treatment: explanation and elaboration. Ann Intern Med. 2008;148(4):295–309.
Painter JE, Borba CP, Hynes M, Mays D, Glanz K. The use of theory in health behavior research from 2000 to 2005: a systematic review. Ann Behav Med. 2008;35(3):358–62.
Schuster L, Kubacki K, Rundle-Thiele S. A theoretical approach to segmenting children’s walking behaviour. Young Consumers. 2015;16(2):159–71.
Campbell M, Fitzpatrick R, Haines A, Kinmonth AL. Framework for design and evaluation of complex interventions to improve health. Br Med J. 2000;321(7262):694.
Article CAS Google Scholar
Medical Research Council (Great Britain). Health services and public Health Research Board. A framework for development and evaluation of RCTs for complex interventions to improve health: Medical Research Council; 2000.
Plotnikoff RC, Costigan SA, Karunamuni N, Lubans DR. Social cognitive theories used to explain physical activity behavior in adolescents: a systematic review and meta-analysis. Prev Med. 2013;56(5):245–53.
Rhodes RE, Nigg CR. Advancing physical activity theory: a review and future directions. Exerc Sport Sci Rev. 2011;39(3):113–9.
Lu W, McKyer ELJ, Lee C, Goodson P, Ory MG, Wang S. Perceived barriers to children’s active commuting to school: a systematic review of empirical, methodological and theoretical evidence. Int J Behav Nutr Phys Act. 2014;11(1):1.
Sniehotta FF. Towards a theory of intentional behaviour change: plans, planning, and self-regulation. Br J Health Psychol. 2009;14(2):261–73.
McMillan TE. The relative influence of urban form on a child’s travel mode to school. Transp Res A Policy Pract. 2007;41(1):69–79.
Sirard JR, Slater ME. Walking and bicycling to school: a review. Am J Lifestyle Med. 2008;2(5):372–96.
Blamey AAM, MacMillan F, Fitzsimons CF, Shaw R, Mutrie N. Using programme theory to strengthen research protocol and intervention design within an RCT of a walking intervention. Evaluation. 2013;19(1):5–23.
Kaplan S, Nielsen TAS, Prato CG. Walking, cycling and the urban form: a Heckman selection model of active travel mode and distance by young adolescents. Transp Res Part D: Transp Environ. 2016;44:55–65.
Kirwan M, Duncan MJ, Vandelanotte C, Mummery WK. Using smartphone technology to monitor physical activity in the 10,000 steps program: a matched case–control trial. J Med Internet Res. 2012;14(2):e55.
KAM G, Tomasone JR, Latimer-Cheung AE, Arbour-Nicitopoulos KP, Bassett-Gunter RL, Wolfe DL. Developing physical activity interventions for adults with spinal cord injury. Part 1: a comparison of social cognitions across actors, intenders, and nonintenders. Rehabil Psychol. 2013;58(3):299.
Crespo NC, Elder JP, Ayala GX, Slymen DJ, Campbell NR, Sallis JF, McKenzie TL, Baquero B, Arredondo EM. Results of a multi-level intervention to prevent and control childhood obesity among Latino children: the Aventuras Para Niños study. Ann Behav Med. 2012;43(1):84–100.
Lobelo F, Kelli HM, Tejedor SC, Pratt M, McConnell MV, Martin SS, Welk GJ. The wild wild west: a framework to integrate mHealth software applications and Wearables to support physical activity assessment, counseling and interventions for cardiovascular disease risk reduction. Prog Cardiovasc Dis. 2016;58(6):584–94.
Hickey AM, Freedson PS. Utility of consumer physical activity trackers as an intervention tool in cardiovascular disease prevention and treatment. Prog Cardiovasc Dis. 2016;58(6):613–9.
Wang JB, Cataldo JK, Ayala GX, Natarajan L, Cadmus-Bertram LA, White MM, Madanat H, Nichols JF, Pierce JP. Mobile and wearable device features that matter in promoting physical activity. J Mob Technol Med. 2016;5(2):2–11.
Boarnet MG, Anderson CL, Day K, McMillan T, Alfonzo M. Evaluation of the California safe routes to school legislation: urban form changes and children’s active transportation to school. Am J Prev Med. 2005;28(2):134–40.
Fusco C, Moola F, Faulkner G, Buliung R, Richichi V. Toward an understanding of children’s perceptions of their transport geographies:(non) active school travel and visual representations of the built environment. J Transp Geogr. 2012;20(1):62–70.
Davison KK, Lawson CT. Do attributes in the physical environment influence children's physical activity? A review of the literature. Int J Behav Nutr Phys Act. 2006;3(1):1.
Carver A, Timperio A, Crawford D. Playing it safe: the influence of neighbourhood safety on children's physical activity—a review. Health Place. 2008;14(2):217–27.
Murtagh S, Rowe DA, Elliott MA, McMinn D, Nelson NM. Predicting active school travel: the role of planned behavior and habit strength. Int J Behav Nutr Phys Act. 2012;9(1):65–73.
Jago R, Baranowski T. Non-curricular approaches for increasing physical activity in youth: a review. Prev Med. 2004;39(1):157–63.
Rundle-Thiele S, Schuster L, Dietrich T, Russell-Bennett R, Drennan J, Leo C, Connor JP. Maintaining or changing a drinking behavior? GOKA's short-term outcomes. J Bus Res. 2015;68(10):2155–63.
Allam A, Kostova Z, Nakamoto K, Schulz PJ. The effect of social support features and gamification on a web-based intervention for rheumatoid arthritis patients: randomized controlled trial. J Med Internet Res. 2015;17(1):e14.
Popkin BM, Adair LS, Ng SW. Global nutrition transition and the pandemic of obesity in developing countries. Nutr Rev. 2012;70(1):3–21.
Sallis JF, Strikmiller PK, Harsha DW, Feldman HA, Ehlinger S, Stone EJ, Williston J, Woods S. Validation of interviewer-and self- administered physical activity checklists for fifth grade students. Age (mean, SD). 1996;10(0):53.
Google Scholar
Fishbein M, Ajzen I. Predicting and changing behavior: the reasoned action approach. New York: Taylor & Francis; 2011.
Download references
Acknowledgements
Not applicable.
No fund was received to conduct the study.
Availability of data and materials
All data generated or analysed during this study are included in this published article [and its Additional file 1 ].
Author information
Authors and affiliations.
Department of Marketing and Social Marketing @ Griffith, Griffith University, 117 Kessels Road, Nathan, QLD, 4111, Australia
Bo Pang, Krzysztof Kubacki & Sharyn Rundle-Thiele
You can also search for this author in PubMed Google Scholar
Contributions
All authors were involved in research design. BP and KK led the literature search strategy, extracted data elements, and compiled the studies. Data analysis was undertaken by BP and KK, and reviewed by SRT. BP developed the first draft of the manuscript. All authors worked on subsequent versions of the manuscript. All authors read and approved the final manuscript.
Corresponding author
Correspondence to Bo Pang .
Ethics declarations
Ethics approval and consent to participate, consent for publication, competing interests.
The authors declare that they have no competing interests.
Publisher’s Note
Springer Nature remains neutral with regard to jurisdictional claims in published maps and institutional affiliations.
Additional file
Additional file 1:.
Active Transport to School Database Search. (DOC 66 kb)
Rights and permissions
Open Access This article is distributed under the terms of the Creative Commons Attribution 4.0 International License ( http://creativecommons.org/licenses/by/4.0/ ), which permits unrestricted use, distribution, and reproduction in any medium, provided you give appropriate credit to the original author(s) and the source, provide a link to the Creative Commons license, and indicate if changes were made. The Creative Commons Public Domain Dedication waiver ( http://creativecommons.org/publicdomain/zero/1.0/ ) applies to the data made available in this article, unless otherwise stated.
Reprints and permissions
About this article
Cite this article.
Pang, B., Kubacki, K. & Rundle-Thiele, S. Promoting active travel to school: a systematic review (2010–2016). BMC Public Health 17 , 638 (2017). https://doi.org/10.1186/s12889-017-4648-2
Download citation
Received : 21 February 2017
Accepted : 28 July 2017
Published : 05 August 2017
DOI : https://doi.org/10.1186/s12889-017-4648-2
Share this article
Anyone you share the following link with will be able to read this content:
Sorry, a shareable link is not currently available for this article.
Provided by the Springer Nature SharedIt content-sharing initiative
- Active school travel
- Interventions
BMC Public Health
ISSN: 1471-2458
- Submission enquiries: [email protected]
- General enquiries: [email protected]
- Credit Cards
- All Credit Cards
- Find the Credit Card for You
- Best Credit Cards
- Best Rewards Credit Cards
- Best Travel Credit Cards
- Best 0% APR Credit Cards
- Best Balance Transfer Credit Cards
- Best Cash Back Credit Cards
- Best Credit Card Sign-Up Bonuses
- Best Credit Cards to Build Credit
- Best Credit Cards for Online Shopping
- Find the Best Personal Loan for You
- Best Personal Loans
- Best Debt Consolidation Loans
- Best Loans to Refinance Credit Card Debt
- Best Loans with Fast Funding
- Best Small Personal Loans
- Best Large Personal Loans
- Best Personal Loans to Apply Online
- Best Student Loan Refinance
- Best Car Loans
- All Banking
- Find the Savings Account for You
- Best High Yield Savings Accounts
- Best Big Bank Savings Accounts
- Best Big Bank Checking Accounts
- Best No Fee Checking Accounts
- No Overdraft Fee Checking Accounts
- Best Checking Account Bonuses
- Best Money Market Accounts
- Best Credit Unions
- All Mortgages
- Best Mortgages
- Best Mortgages for Small Down Payment
- Best Mortgages for No Down Payment
- Best Mortgages for Average Credit Score
- Best Mortgages No Origination Fee
- Adjustable Rate Mortgages
- Affording a Mortgage
- All Insurance
- Best Life Insurance
- Best Life Insurance for Seniors
- Best Homeowners Insurance
- Best Renters Insurance
- Best Car Insurance
- Best Pet Insurance
- Best Boat Insurance
- Best Motorcycle Insurance
- Travel Insurance
- Event Ticket Insurance
- Small Business
- All Small Business
- Best Small Business Savings Accounts
- Best Small Business Checking Accounts
- Best Credit Cards for Small Business
- Best Small Business Loans
- Best Tax Software for Small Business
- Personal Finance
- All Personal Finance
- Best Budgeting Apps
- Best Expense Tracker Apps
- Best Money Transfer Apps
- Best Resale Apps and Sites
- Buy Now Pay Later (BNPL) Apps
- Best Debt Relief
- Credit Monitoring
- All Credit Monitoring
- Best Credit Monitoring Services
- Best Identity Theft Protection
- How to Boost Your Credit Score
- Best Credit Repair Companies
- Filing For Free
- Best Tax Software
- Best Tax Software for Small Businesses
- Tax Refunds
- Tax Brackets
- Taxes By State
- Tax Payment Plans
- Help for Low Credit Scores
- All Help for Low Credit Scores
- Best Credit Cards for Bad Credit
- Best Personal Loans for Bad Credit
- Best Debt Consolidation Loans for Bad Credit
- Personal Loans if You Don't Have Credit
- Best Credit Cards for Building Credit
- Personal Loans for 580 Credit Score Lower
- Personal Loans for 670 Credit Score or Lower
- Best Mortgages for Bad Credit
- Best Hardship Loans
- All Investing
- Best IRA Accounts
- Best Roth IRA Accounts
- Best Investing Apps
- Best Free Stock Trading Platforms
- Best Robo-Advisors
- Index Funds
- Mutual Funds
- Home & Kitchen
- Gift Guides
- Deals & Sales
- Sign up for the CNBC Select Newsletter
- Subscribe to CNBC PRO
- Privacy Policy
- Your Privacy Choices
- Terms Of Service
- CNBC Sitemap
Follow Select
Our top picks of timely offers from our partners

Find the best credit card for you
5 best credit cards that offer pre-approval or pre-qualification in 2024, pre-approval doesn't guarantee approval, but it can help you avoid an unnecessary hard pull on your credit..

Terms apply to American Express benefits and offers. Visit americanexpress.com to learn more.
When you apply for a credit card, the issuer performs what is known as a hard pull or hard inquiry , which shows up on your credit report. Hard pulls temporarily lower your credit score, which isn't the end of the world, but it's better to avoid racking up unnecessary hard inquiries since they can remain on your credit report for up to two years. One way to do this is by going through a card issuer's pre-approval or pre-qualification process before applying.
Getting a pre-approved offer for a credit card doesn't guarantee you'll be approved, but it can give you a better idea of your approval odds with no hard inquiry. There is no impact to your credit score until you formally apply.
Not every card issuer offers pre-approvals. Below, CNBC Select details the top credit cards that generally offer pre-approval or pre-qualification and how they work. (See our methodology for more information on how we made this list.)
Best credit cards for pre-approval
- Best for no annual fee: Wells Fargo Active Cash® Card
- Best for balance transfers: Citi Double Cash® Card
- Best for travel rewards: American Express® Gold Card
- Best for cash-back: Discover it® Cash Back
- Best for premium perks: Capital One Venture X Rewards Credit Card (see rates & fees )
Best for no annual fee
Wells fargo active cash® card.
Unlimited 2% cash rewards on purchases
Welcome bonus
Earn a $200 cash rewards bonus after spending $500 in purchases in the first 3 months
0% intro APR for 15 months from account opening on purchases and qualifying balance transfers; balance transfers made within 120 days qualify for the intro rate
Regular APR
20.24%, 25.24%, or 29.99% Variable APR on purchases and balance transfers
Balance transfer fee
3% intro for 120 days from account opening then BT fee of up to 5%, min: $5
Foreign transaction fee
Credit needed.
Excellent/Good
See rates and fees , terms apply.
- Unlimited cash rewards
- $200 cash rewards welcome bonus
- No annual fee
- Introductory APR period for first 15 months
- Access to Visa Signature® Concierge
- Get up to $600 cell phone protection (subject to a $25 deductible)
- 3% fee charged on foreign transactions
Who's this for? The Wells Fargo Active Cash® Card (see rates and fees ) is a jack of all trades, with an easy-to-earn welcome bonus , generous intro-APR offer and a lucrative flat-rate rewards structure — all for no annual fee .
Standout benefits: This card earns unlimited 2% cash rewards on every purchase. This simple cash-reward rate takes the headaches out of maximizing the return you get on your credit card spending.
Wells Fargo pre-approval process: Fill out this Wells Fargo pre-qualification form with your name, address and the last four digits of your Social Security Number (SSN). If you have a Wells Fargo online account, you can log in to expedite the process.
[ Jump to more details ]
Best for balance transfers
Citi double cash® card.
Earn 2% on every purchase with unlimited 1% cash back when you buy, plus an additional 1% as you pay for those purchases. To earn cash back, pay at least the minimum due on time. Plus, for a limited time, earn 5% total cash back on hotel, car rentals and attractions booked on the Citi Travel℠ portal through 12/31/24
Earn $200 cash back after you spend $1,500 on purchases in the first 6 months of account opening. This bonus offer will be fulfilled as 20,000 ThankYou® Points, which can be redeemed for $200 cash back.
0% for the first 18 months on balance transfers; N/A for purchases
19.24% - 29.24% variable
For balance transfers completed within 4 months of account opening, an intro balance transfer fee of 3% of each transfer ($5 minimum) applies; after that, a balance transfer fee of 5% of each transfer ($5 minimum) applies
Fair/Good/Excellent
Read our Citi Double Cash® Card review.
- 2% cash back on all eligible purchases
- Simple cash-back program that doesn't require activation or spending caps
- One of the longest intro periods for balance transfers at 18 months
- 3% fee charged on purchases made outside the U.S.
- Estimated rewards earned after 1 year: $443
- Estimated rewards earned after 5 years: $2,213
Who's this for? The Citi Double Cash® Card is ideal for those seeking a strong introductory APR offer for balance transfers and still want to earn valuable rewards.
Standout benefits: Eligible balance transfers qualify for an intro 0% APR for the first 18 months, then a variable 19.24% to 29.24% APR applies. There is an intro balance transfer fee of 3% of each transfer completed in the first four months ($5 minimum). The standard balance transfer fee of 5% of each transfer ($5 minimum) applies thereafter.
Citi pre-approval process: See what Citi credit card offers you're pre-qualified for with this form . Enter your name, email, address and the last four digits of your SSN.
Best for travel rewards
American express® gold card.
4X Membership Rewards® points at Restaurants (plus takeout and delivery in the U.S.) and at U.S. supermarkets (on up to $25,000 per calendar year in purchases, then 1X), 3X points on flights booked directly with airlines or on amextravel.com, 1X points on all other purchases
Earn 60,000 Membership Rewards® points after you spend $6,000 on eligible purchases with your new Card within the first 6 months of Card Membership.
Not applicable
See Pay Over Time APR
Read our American Express® Gold Card review .
- Up to $120 dining credit annually ($10 a month) for purchases made with Grubhub, Goldbelly and other eligible restaurants (after a one-time enrollment)
- Up to $120 Uber Cash annually ($10 a month) for U.S. Uber Eats orders and U.S. Uber rides (card must be added to Uber app to receive the Uber Cash benefit)
- Strong rewards program with 4X points earned at restaurants and 3X points earned on flights booked directly with airlines or amextravel.com
- Baggage insurance plan covers up to $1,250 for carry-on baggage and up to $500 for checked baggage that is damaged, lost or stolen
- No fee charged on purchases made outside the U.S.
- No introductory APR period
- $250 annual fee
- Estimated rewards earned after 1 year: $1,074
- Estimated rewards earned after 5 years: $2,969
Rewards totals incorporate the points earned from the welcome bonus
Who's this for? The American Express® Gold Card is great for earning travel rewards thanks to its generous bonuses on common spending categories like dining and groceries.
Standout benefits: Cardholders get up to $120 in annual dining credit (up to $10 per month at Grubhub , Goldbelly, The Cheesecake Factory and other participating restaurants; enrollment is required) and up to $120 in Uber Cash ($10 per month) to put toward rides in the U.S. and dining via Uber Eats (you must add your Amex Gold Card as a payment method in the Uber app to enroll).
American Express pre-approval process: See what American Express card offers you may be eligible for by filling out this form with your name, address, last four digits of your SSN and your annual income. If you already have an Amex account, you may need to open the form in incognito mode or clear your browser's cache to access the page.
Best for cash-back
Discover it® cash back.
Earn 5% cash back on everyday purchases at different places you shop each quarter like grocery stores, restaurants, gas stations, and more, up to the quarterly maximum when you activate. Plus, earn unlimited 1% cash back on all other purchases-automatically.
Discover will match all the cash back earned for all new cardmembers at the end of your first year.
0% for 15 months on purchases
17.24% to 28.24% Variable
3% intro balance transfer fee, up to 5% fee on future balance transfers (see terms)*
Good / Excellent
* See rates and fees , terms apply.
Read our Discover it® Cash Back review.
- Cash-back program
- Generous welcome bonus
- Cash-back categories must be activated each quarter
- Cash-back program limits earnings: Enroll every quarter to earn 5% cash back in various categories on up to $1,500 in quarterly purchases, then 1%
Who's this for? The Discover it® Cash Back is a relatively easy-to-get cash-back card with no annual fee and useful rotating bonus categories .
Standout benefits: This card has a unique welcome offer that can supercharge your cash-back earnings. Discover will match the cash back new cardholders earn in the first year. So, purchases that qualify for 5% cash back would effectively earn 10% back in your first year. Plus, the card has no foreign transaction fees.
Discover pre-approval process: Fill out this Discover credit card pre-approval form with your name, address, date of birth, housing payment, student status and gross income to see what offers you're eligible for. If you don't qualify for an unsecured card, you may want to consider a secured credit card such as the Discover it® Secured Card which doesn't require a credit score.
Best for premium perks
Capital one venture x rewards credit card.
Unlimited 2X miles on all eligible purchases, and 5 Miles per dollar on flights and 10 Miles per dollar on hotels and rental cars when booked via Capital One Travel portal
Earn 75,000 bonus miles once you spend $4,000 on purchases within the first 3 months from account opening
19.99% - 29.99% variable APR
$0 at the Transfer APR, 4% of the amount of each transferred balance that posts to your account at a promotional APR that Capital One may offer to you
Foreign transaction fees
Read our Capital One Venture X Rewards Credit Card review.
- Large welcome bonus
- No foreign transaction fees
- Up to $100 statement credits for either Global Entry or TSA PreCheck®
- Unlimited complimentary access for you and two guests to 1,300+ lounges, including Capital One Lounges and the Partner Lounge Network
- High annual fee
- No introductory 0% APR period
Who's this for? The Capital One Venture X Rewards Credit Card is geared towards those seeking luxury benefits like airport lounge access, annual travel credits, various travel and shopping protections and more.
Standout benefits: Every year, Capital One Venture X Card members receive up to $300 in travel credits for bookings made through Capital One Travel and 10,000-anniversary bonus miles (worth $100 in travel). Those two benefits alone can offset the card's $395 annual fee (see rates and fees ).
Capital One pre-approval process: You can see what Capital One cards you're pre-approved for by filling out this form . You'll need to enter your name, address, email address, phone number, employment status, education, income, housing payment, date of birth, SSN and what type of bank accounts you have.
More on our top credit cards that offer pre-approval or pre-qualification
The Wells Fargo Active Cash® Card is a no annual fee card that can help you earn cash rewards, while enjoying various money-saving benefits.
- Unlimited 2% cash rewards on all purchases
Earn $200 in cash rewards after spending $500 in purchases in the first three months of account opening.
Notable perks
Cardholders can take advantage of cell phone insurance when they pay their monthly bill with the card. This insurance covers damage, theft and loss of a cell phone and has a $25 deductible. You can be reimbursed for up to two claims per 12 months and up to $600 per claim.
Cardholders can also save on interest with the card's intro-APR offer. Purchases and eligible balance transfers qualify for an intro 0% APR for 15 months. then a variable 20.24%, 25.24% or 29.99% applies. To qualify for the intro APR, balance transfers must be completed within 120 days of opening the account. There is an intro balance transfer fee , and for the first 120 days you'll pay 3% of the amount of each transfer ($5 minimum). After the intro period, the balance transfer fee increases to 5% of the amount of each transfer ($5 minimum).
[ Return to card summary ]
The Citi Double Cash® Card is a cash-back credit card , but it earns cash back in the form of Citi ThankYou points , which which can be redeemed in lots of ways, including the option to transfer them to travel partners.
- 5% total cash back on Citi travel bookings (through Dec. 31, 2024)
- 2% cash back on all purchases: 1% back when you buy and 1% back as you pay
Earn a $200 cash bonus after spending $1,500 on purchases in the first six months of account opening.
The ThankYou® points can be redeemed for cash back, gift cards and travel at a rate of one cent per point. Cardholders also have access to a small number of Citi's travel partners, including Wyndham, Choice and JetBlue. If you have a Citi card that enables full transfers, such as the Citi Premier® Card , you can combine the points you earn with your Double Cash and then transfer those points to all of Citi's partner hotel and airline loyalty programs.
There are also several special cardmember programs, including Citi Entertainment℠, which gives cardholders first access to purchase tickets for thousands of concerts and events. The card also provides access to Citi® Identity Theft Solutions, a service that will help you if you're a victim of identity theft.
The American Express® Gold Card is a travel rewards card with a long list of benefits that can easily make the annual fee worth paying (see rates and fees ). Plus, the Amex Membership Rewards points you earn with this card are some of the most valuable travel points out there since they can be transferred to a variety of airline or hotel partners.
- 4X points at restaurants (plus takeout and delivery in the U.S.)
- 4X points at U.S. supermarkets (on up to $25,000 per calendar year in purchases, then 1X)
- 3X points on flights booked directly with airlines or on Amextravel.com
- 1X points on all other purchases
Earn 60,000 points after you spend $6,000 on eligible purchases within the first six months of card membership.
$250 (see rates and fees )
Cardholders receive up to $120 in dining credit per year ($10 per month) at participating partners and up to $120 in Uber Cash per year ($10 per month) after you add your Amex Gold Card as a payment method in the Uber app. The card also offers no foreign transaction fees (see rates and fees ), baggage insurance, rental car coverage (secondary), extended warranty, purchase protection and trip delay insurance .
Eligibility and Benefit level varies by Card. Terms, Conditions and Limitations Apply.
Please visit americanexpress.com/benefitsguide for more details.
Underwritten by New Hampshire Insurance Company, an AIG Company.
The Discover it® Cash Back is a no-annual-fee cash-back rewards card that allows you to earn a generous 5% back on rotating spending categories.
- 5% cash back on the first $1,500 in purchases in rotating categories each quarter (when you activate), then 1% cash back. Check out Discover's 5% cash-back calendar .
- 1% cash back on all other purchases
Discover will match the cash back you earn at the end of the first year.
New card members receive an intro 0% APR for 15 months on purchases and eligible balance transfers, then a variable 17.24% to 28.24% applies. An intro balance transfer fee of 3% of the amount you transfer applies to eligible transfers. The standard transfer fee on future balance transfers is up to 5% of the amount of each transfer. (See rates and fees )
The card charges $0 in foreign transaction fees , which can save you money when traveling abroad.
The Capital One Venture X Rewards Credit Card (see rates and fees ) is a premium credit card with a straightforward rewards structure, a long list of benefits and a lower annual fee than other high-end cards with similar features.
- 10X miles per dollar on hotels and rental cars booked through Capital One Travel portal
- 5X miles per dollar on flights booked through Capital One Travel
- 5X miles on Capital One Entertainment purchases (through Dec. 31, 2025)
- 2X miles on all other purchases
Earn 75,000 bonus miles after spending $4,000 on purchases within the first three months of account opening.
In addition to the annual $300 Capital One Travel credit and 10,000 anniversary bonus miles, the Capital One Venture X Card comes with airport lounge access for the primary cardholder and authorized users. One great feature of this card is that you can add up to four authorized users for free and each cardholder gets access to Priority Pass lounges, Plaza Premium Lounges and Capital One Lounges .
Other benefits include:
- Hertz Presidents Circle status (enrollment required)
- Global Entry/TSA PreCheck® application fee credit (worth up to $100)
- Cell phone protection
- Visa Infinite Concierge
- Rental car collision damage waiver (primary)
- Trip cancellation and interruption coverage
- Trip delay reimbursement
- Lost luggage reimbursement
- Extended warranty protection
- Return protection
- Purchase security
What's the difference between a pre-approval and a pre-qualification?
The terms pre-approval and pre-qualification both refer to the card issuers' pre-screening process that can help you determine whether you'll qualify for a credit card without a hard pull on your credit reports. Prequalified offers are typically initiated by consumers who want to check their approval odds, while preapproved offers are generally unsolicited offers from card issuers.
Does pre-approval or pre-qualification result in a hard credit pull?
Most credit card pre-approvals do not result in a hard pull of your credit. Some issuers require a Social Security Number (SSN) or the last four digits of your SSN to process a pre-approval, but this is generally done to verify your identity and shouldn't result in a credit check unless otherwise stated.
Does pre-approval guarantee approval?
If you qualify for a pre-approved credit card or receive a pre-screened offer in the mail, that does not guarantee you'll be approved. Your credit score, income and history with the card issuers are all taken into account, but won't be fully reviewed unless you submit a traditional card application.
Bottom line
Getting a pre-approved, pre-qualified or pre-screened credit card offer doesn't guarantee you'll get approved for the card if you apply. However, seeing whether you're pre-approved for a card offer is easy and typically doesn't require a hard credit pull. So it doesn't hurt to explore what offers you may qualify for.
Money matters — so make the most of it. Get expert tips, strategies, news and everything else you need to maximize your money, right to your inbox. Sign up here .
Why trust CNBC Select?
At CNBC Select, our mission is to provide our readers with high-quality service journalism and comprehensive consumer advice so they can make informed decisions with their money. Every credit card article is based on rigorous reporting by our team of expert writers and editors with extensive knowledge of credit card products . While CNBC Select earns a commission from affiliate partners on many offers and links, we create all our content without input from our commercial team or any outside third parties, and we pride ourselves on our journalistic standards and ethics. See our methodology for more information on how we choose the best business credit cards for LLCs.
Our methodology
To determine which business cards offer the best value and pre-approval, CNBC Select analyzed the most popular credit cards available to U.S. consumers that also had a publicly available pre-approval or pre-qualification process at the time of writing. We compared each card on a range of features, including the annual fee, employee card fee, rewards, welcome bonus, introductory and standard APR and foreign transaction fees. We also considered additional perks, the application process and how easy it is to redeem points.
Catch up on CNBC Select's in-depth coverage of credit cards , banking and money , and follow us on TikTok , Facebook , Instagram and Twitter to stay up to date.
For rates and fees of the American Express® Gold Card, click here .
For rates and fees of the Discover it® Cash Back, click here .
For rates and fees of the Wells Fargo Active Cash® Card, click here .

- 3 best Chase balance transfer credit cards of 2024 Jason Stauffer
- AIG Travel Guard insurance review: What you need to know Ana Staples
- Here are the 8 best password managers Ryley Amond
IMAGES
COMMENTS
Two studies found significant benefits of active travel for reducing diabetes risk. A study in Japan by Sato et al found a 27% reduced odds of type 2 diabetes among men who walked more than 21 minutes to work compared with those who walked less than 10 minutes (CI:0.58-0.92) .
Background Increasing active travel (primarily walking and cycling) has been widely advocated for reducing obesity levels and achieving other population health benefits. However, the strength of evidence underpinning this strategy is unclear. This study aimed to assess the evidence that active travel has significant health benefits. Methods The study design was a systematic review of (i) non ...
In England, the average number of early deaths prevented is 1,189 per year, assuming that the hypothetical scenario is achieved in 1 year and the whole assessment period is 10 years. The number of early preventable deaths per 100,000 population per year is highest in North East England (3.6 deaths per 100,000 people) and the West Midlands (3.3 ...
Active travel, also described as active transport or transportation, ... and economic benefits of active travel are clear. Searches for evidence were conducted between 2010 and 2019 in a median of six databases. Ten of the included studies were formal systematic reviews (two with meta-analyses, one using mixed methods, and one with qualitative ...
Our cycling tips and advice can help you play your part in protecting the planet through active travel. As you can imagine, there are many benefits to picking up a pair of wheels - whether that's a regular bicycle, an electric bike or an adapted cycle, which aren't just about reducing carbon emissions. Benefits that come from cycling include:
Big climate benefits. Road transport is responsible for around a fifth (21%) of the UK's total greenhouse gas emissions. Switching to active travel modes, even for some of our journeys, is one of the most immediate and accessible ways to address this. Better use of space. The average car is stationary for 95% of its lifespan.
A 2014 study on nearly 18,000 commuters found that switching from car to active travel improved psychological wellbeing, and showed that while a longer car commute decreased feelings of wellbeing ...
The benefits of active travel. Encouraging mode shift to walking, wheeling and cycling is one of the most cost-effective ways of reducing transport emissions, as outlined in the transport ...
Re-examines the concept of active travel, offering a more inclusive definition. ... could be claimed in terms of improved air quality and reduction in carbon and noise pollution among the many other benefits of greater active travel use. Expanding the constituency of active travellers may bring 'strength in numbers' benefits to its members ...
Active travel is an important opportunity for savings in terms of preventing ill health. Reducing carbon emissions and helping reach net-zero carbon goals - Changing to active travel can have significant lifecycle carbon emissions benefits. The largest benefits come from shifts from car to active travel for business, social and commuting journeys.
3. The role of active travel in improving mental health. Poor mental health is a significant and often poorly understood issue in the UK, with one in six workers experiencing depression, anxiety or problems relating to stress at any one time. Evidence suggests walking and cycling can contribute positively towards mental health both through ...
Cycling and walking can help fight overweight and reduce physical inactivity, which causes one million deaths per year in the European Region. Both means of active transport can also help to reduce air pollution that claims more than half a million deaths every year. Evidence shows that investments in policies that promote safe cycling and walking can play a crucial role in shaping health ...
Active travel modes are the lowest producers of emissions and air pollution per passenger-km. Despite the clear health and environmental benefits of active travel at an individual level, it is important to note that their impact on a societal level are minimal unless a consequential mode shift can be achieved.
Active Design promotes physical activity, health and stronger communities through the way we design and build our towns and cities. It has 10 principles to inspire and inform the layout of cities, towns, villages, neighbourhoods, buildings, streets and open spaces, to create more opportunities for physical activity. You can find out exactly how ...
Abstract. Background: Increasing the proportion of active travel (primarily walking and cycling) within the population has been widely advocated as a route to reducing obesity levels and achieving other population health benefits. However, the strength of evidence underpinning these assumptions is not known. The objective of this study was to assess the evidence that active travel has ...
Developing an Active Travel Guide is a great way to promote the benefits of different active commuting methods including the health and environmental benefits of each. A key aspect of supporting Active Travel is ensuring employees have access to end-of-trip facilities that allow them to get ready for their workday.
The health benefits of physical activity have been well documented [], and a growing number of studies have confirmed that these benefits are linked to walking and cycling specifically [2,3,4].For people who cycle or walk at a level corresponding to World Health Organization (WHO) recommendations for minimum physical activity (i.e. 150 min/week), the risk of mortality for all causes is reduced ...
Abstract. Background: Increasing active travel (primarily walking and cycling) has been widely advocated for reducing obesity levels and achieving other population health benefits. However, the strength of evidence underpinning this strategy is unclear. This study aimed to assess the evidence that active travel has significant health benefits.
Walking or wheeling are great travel options and are also the most accessible - walking costs nothing while wheeling provides more opportunity to access the benefits of active travel. Small steps make a difference - choosing to walk or wheel just one mile to the shop and back once a week rather than drive will see fuel savings of £25 and ...
An active adventure is an incredible opportunity to revitalize yourself, mind, body, and soul. The slower pace of active travel allows you to immerse yourself in the wonders of your surroundings, providing a unique opportunity to clear your mind of distractions and find tranquility. As you hike through fragrant lemon orchards in Italy or cycle ...
Given active travel is a devolved policy area, this briefing relates primarily to active travel policies in England. Benefits of Active travel . Investing in active travel can bring environmental, health and economic benefits: Promoting active travel can result in reduced emissions of Nitrogen Dioxide (NO2), Particulate matter (PM) and CO2 ...
The Active Travel Act: 10 years on. Early October saw Members, stakeholders and supporters come together to mark the ten year anniversary of the Active Travel (Wales) Act being passed unanimously by the Senedd. Described by Sustrans in 2013 as "pioneering legislation", the Welsh Government set out "to make walking and cycling the most ...
Active school travel (AST) remains an important source of physical activity for children [].AST has been shown to provide benefits such as reduction in children's Body Mass Index that long-term leads to a reduction in obesity-related diseases [], improvement in academic performance at school [], and as part of a larger picture, reduction in car use benefitting the environment [].
Explore T-Mobile's travel benefits. Enjoy our best deals and discounts whether you are traveling across the country or across the globe. ... Active voice line and AAA member validation required. Receive 1 year AAA Basic or Classic membership/renewal On Us when you register at Promotions.
Contact the travel representative at your military hospital or clinic. Do you have a civilian PCM? Is your sponsor an active or retired member of the Coast Guard? If yes, then you should contact the DHA Prime Travel Benefit office. Toll-free: (844) 204-9351 Email: [email protected]; Step 2: Make Your Travel Arrangements and Go to Your ...
Other benefits and drawbacks: The Wells Fargo Active Cash® Card offers up to $600 per claim in cellphone protection (subject to a $25 deductible) when you pay a monthly cellphone bill with the ...
When redeeming Chase Ultimate Rewards points for travel through the Chase Travel portal, cardholders get 50% more value from their rewards. For example, redeeming 50,000 points will get you $750 ...
The Wells Fargo Active Cash® Card (see rates and fees) is a jack of all trades, ... (worth $100 in travel). Those two benefits alone can offset the card's $395 annual fee ...