Freelance iOS, macOS, Apple Watch, and Apple TV Developer
Web inspector on ios devices and simulators.
Want to keep up to date? Sign up to my free newsletter which will give you exclusive updates on all of my projects along with early access to future apps.
Over the past few weeks I’ve worked on a number of projects that have necessitated me working with HTML and JavaScript be that via Safari on iOS, an SFSafariViewController, or in an embedded WKWebView. In all of these cases, I’ve needed to dive into the DOM to see what styles are being applied to certain elements or dig into a JavaScript Console to work out why some code isn’t working. On desktop, this is trivial as Safari has a Web Inspector panel built in similar to other browsers. It turns out it is also trivial on mobile as the exact same tool can be used with both iOS simulators and physical devices.
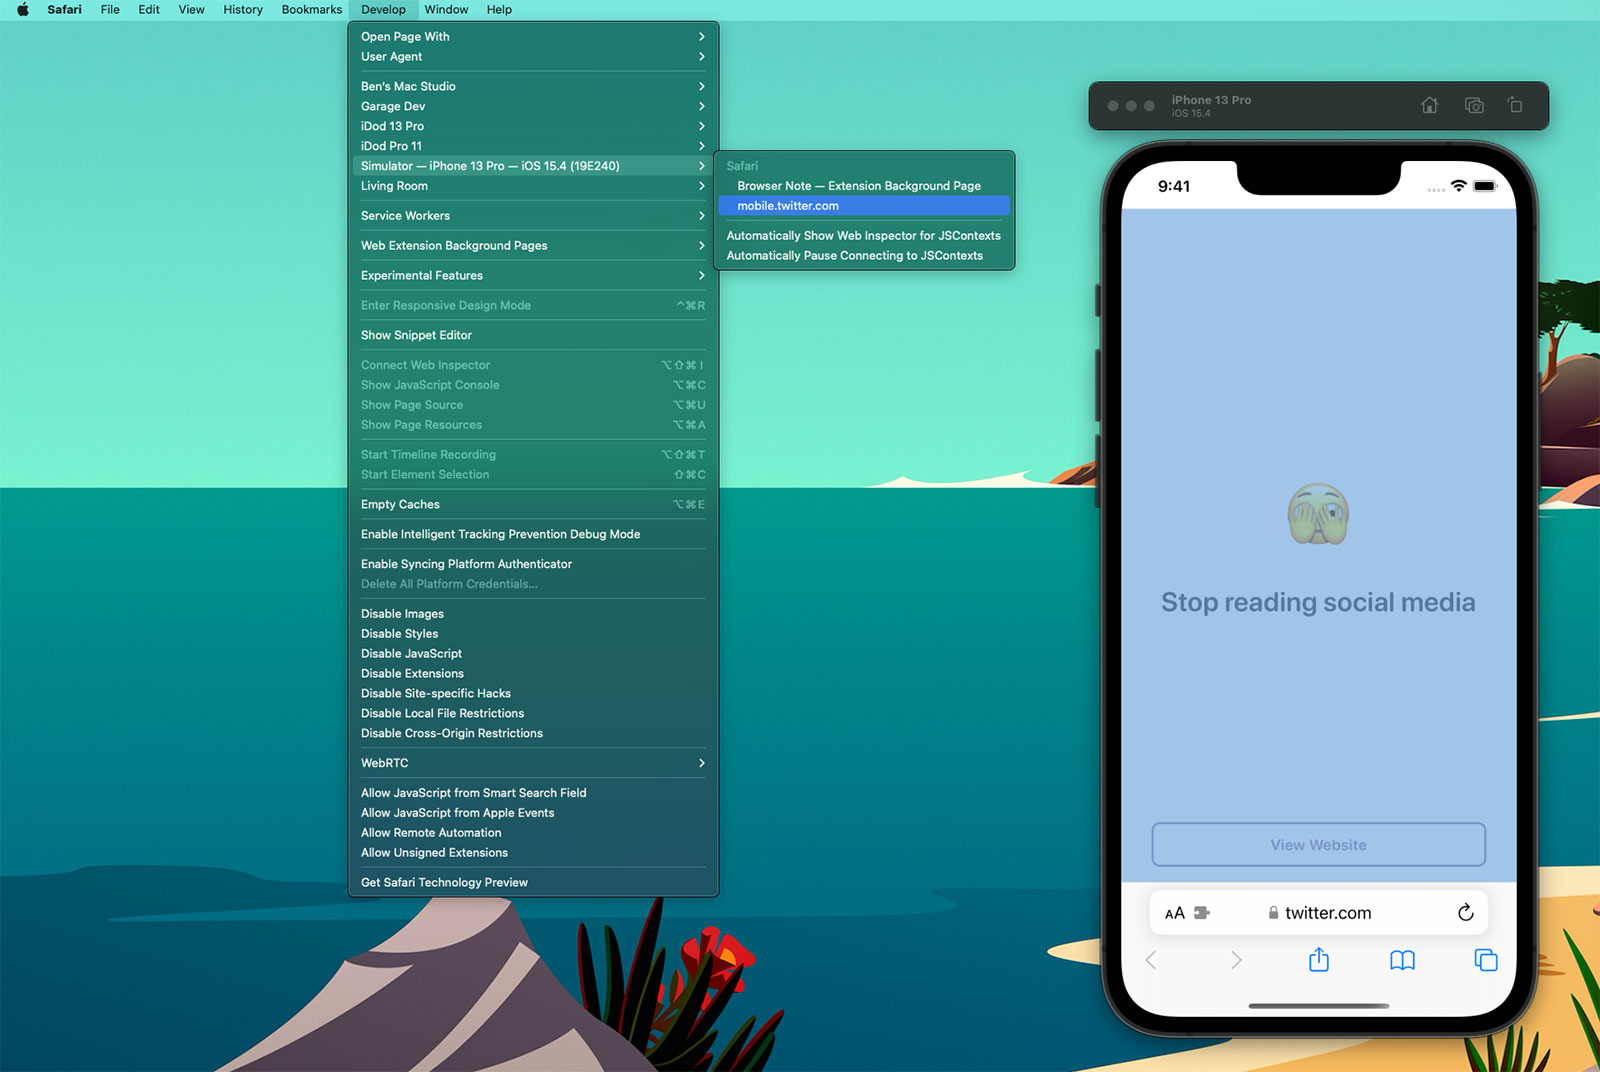
If you select the ‘Develop’ tab from the menu bar of Safari on macOS, you’ll see a list of all of your connected devices and actively running simulators 1 . Drilling into this will then show all of the active web instances you can interact with; notice how the content within Safari has highlighted blue within the Simulator as I’ve moused over the twitter.com web instance above. When you click, a web inspector panel is then produced which allows you to make all the usual interrogations and changes you can within desktop Safari such as interacting with the console or changing CSS values of elements to see how they would look in realtime.
Here’s an example using a WKWebView within one of my client projects, Yabla Spanish :
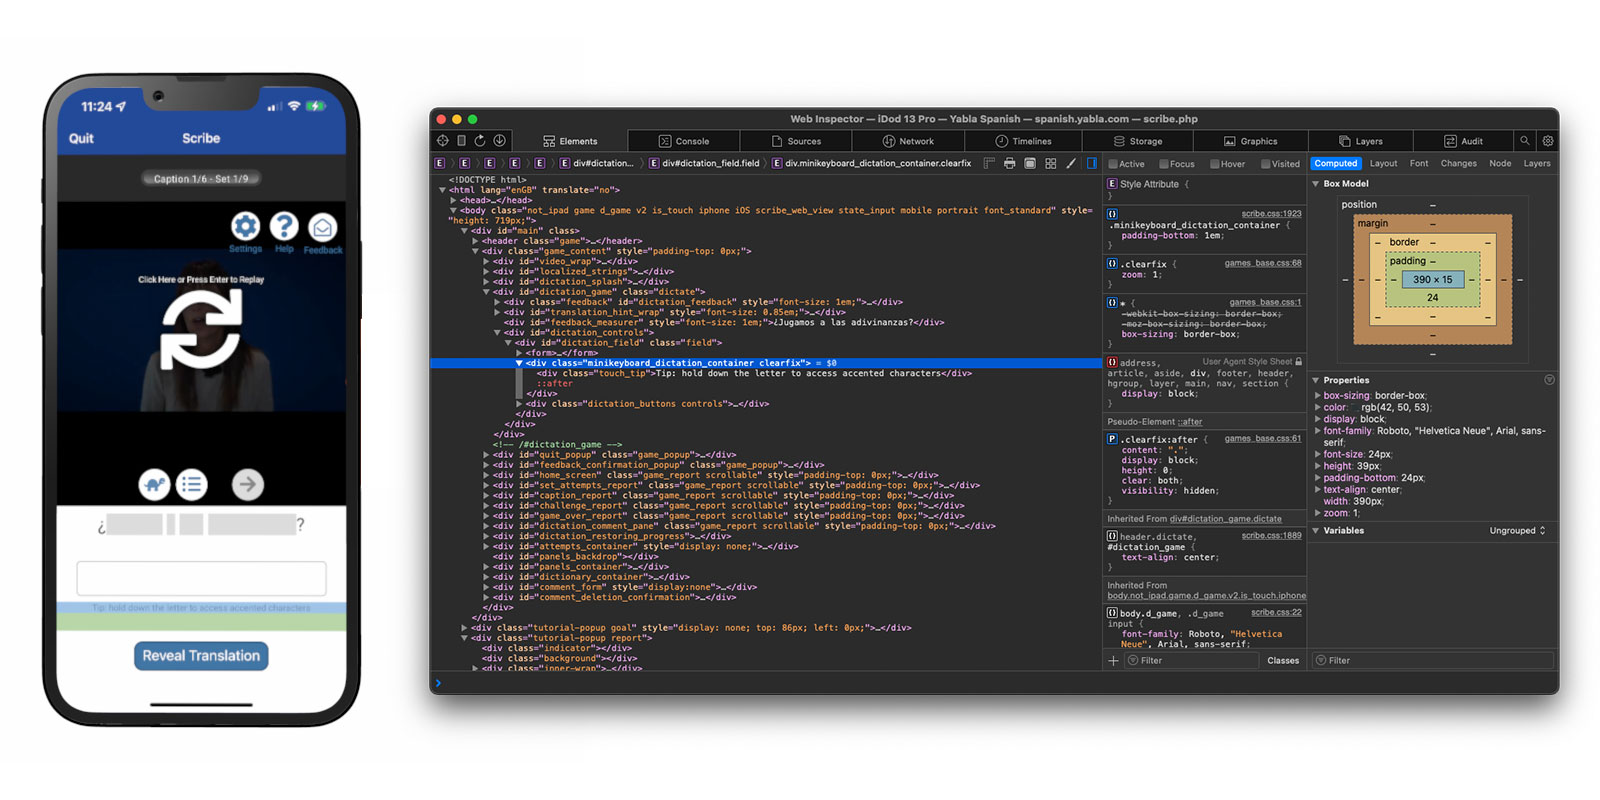
Discovering that simulators and devices could be interacted with in this way has been a huge timesaver for me. Whilst developing Browser Note , I was constantly needing to tweak CSS values and investigate the current state of the DOM as websites have various tricks to try and make ads or cookie notices appear on top of all content (and the note needed to be on top at all times - you should totally take a look at Browser Note whilst you’re here). In doing this, I was then able to put this knowledge to use on no less than 3 client projects in the past month; this validates my theory that by working on your own side projects you can improve your efficiency when it comes to work projects.
There are a few caveats to be aware of when using the Web Inspector with an iOS device or simulator:
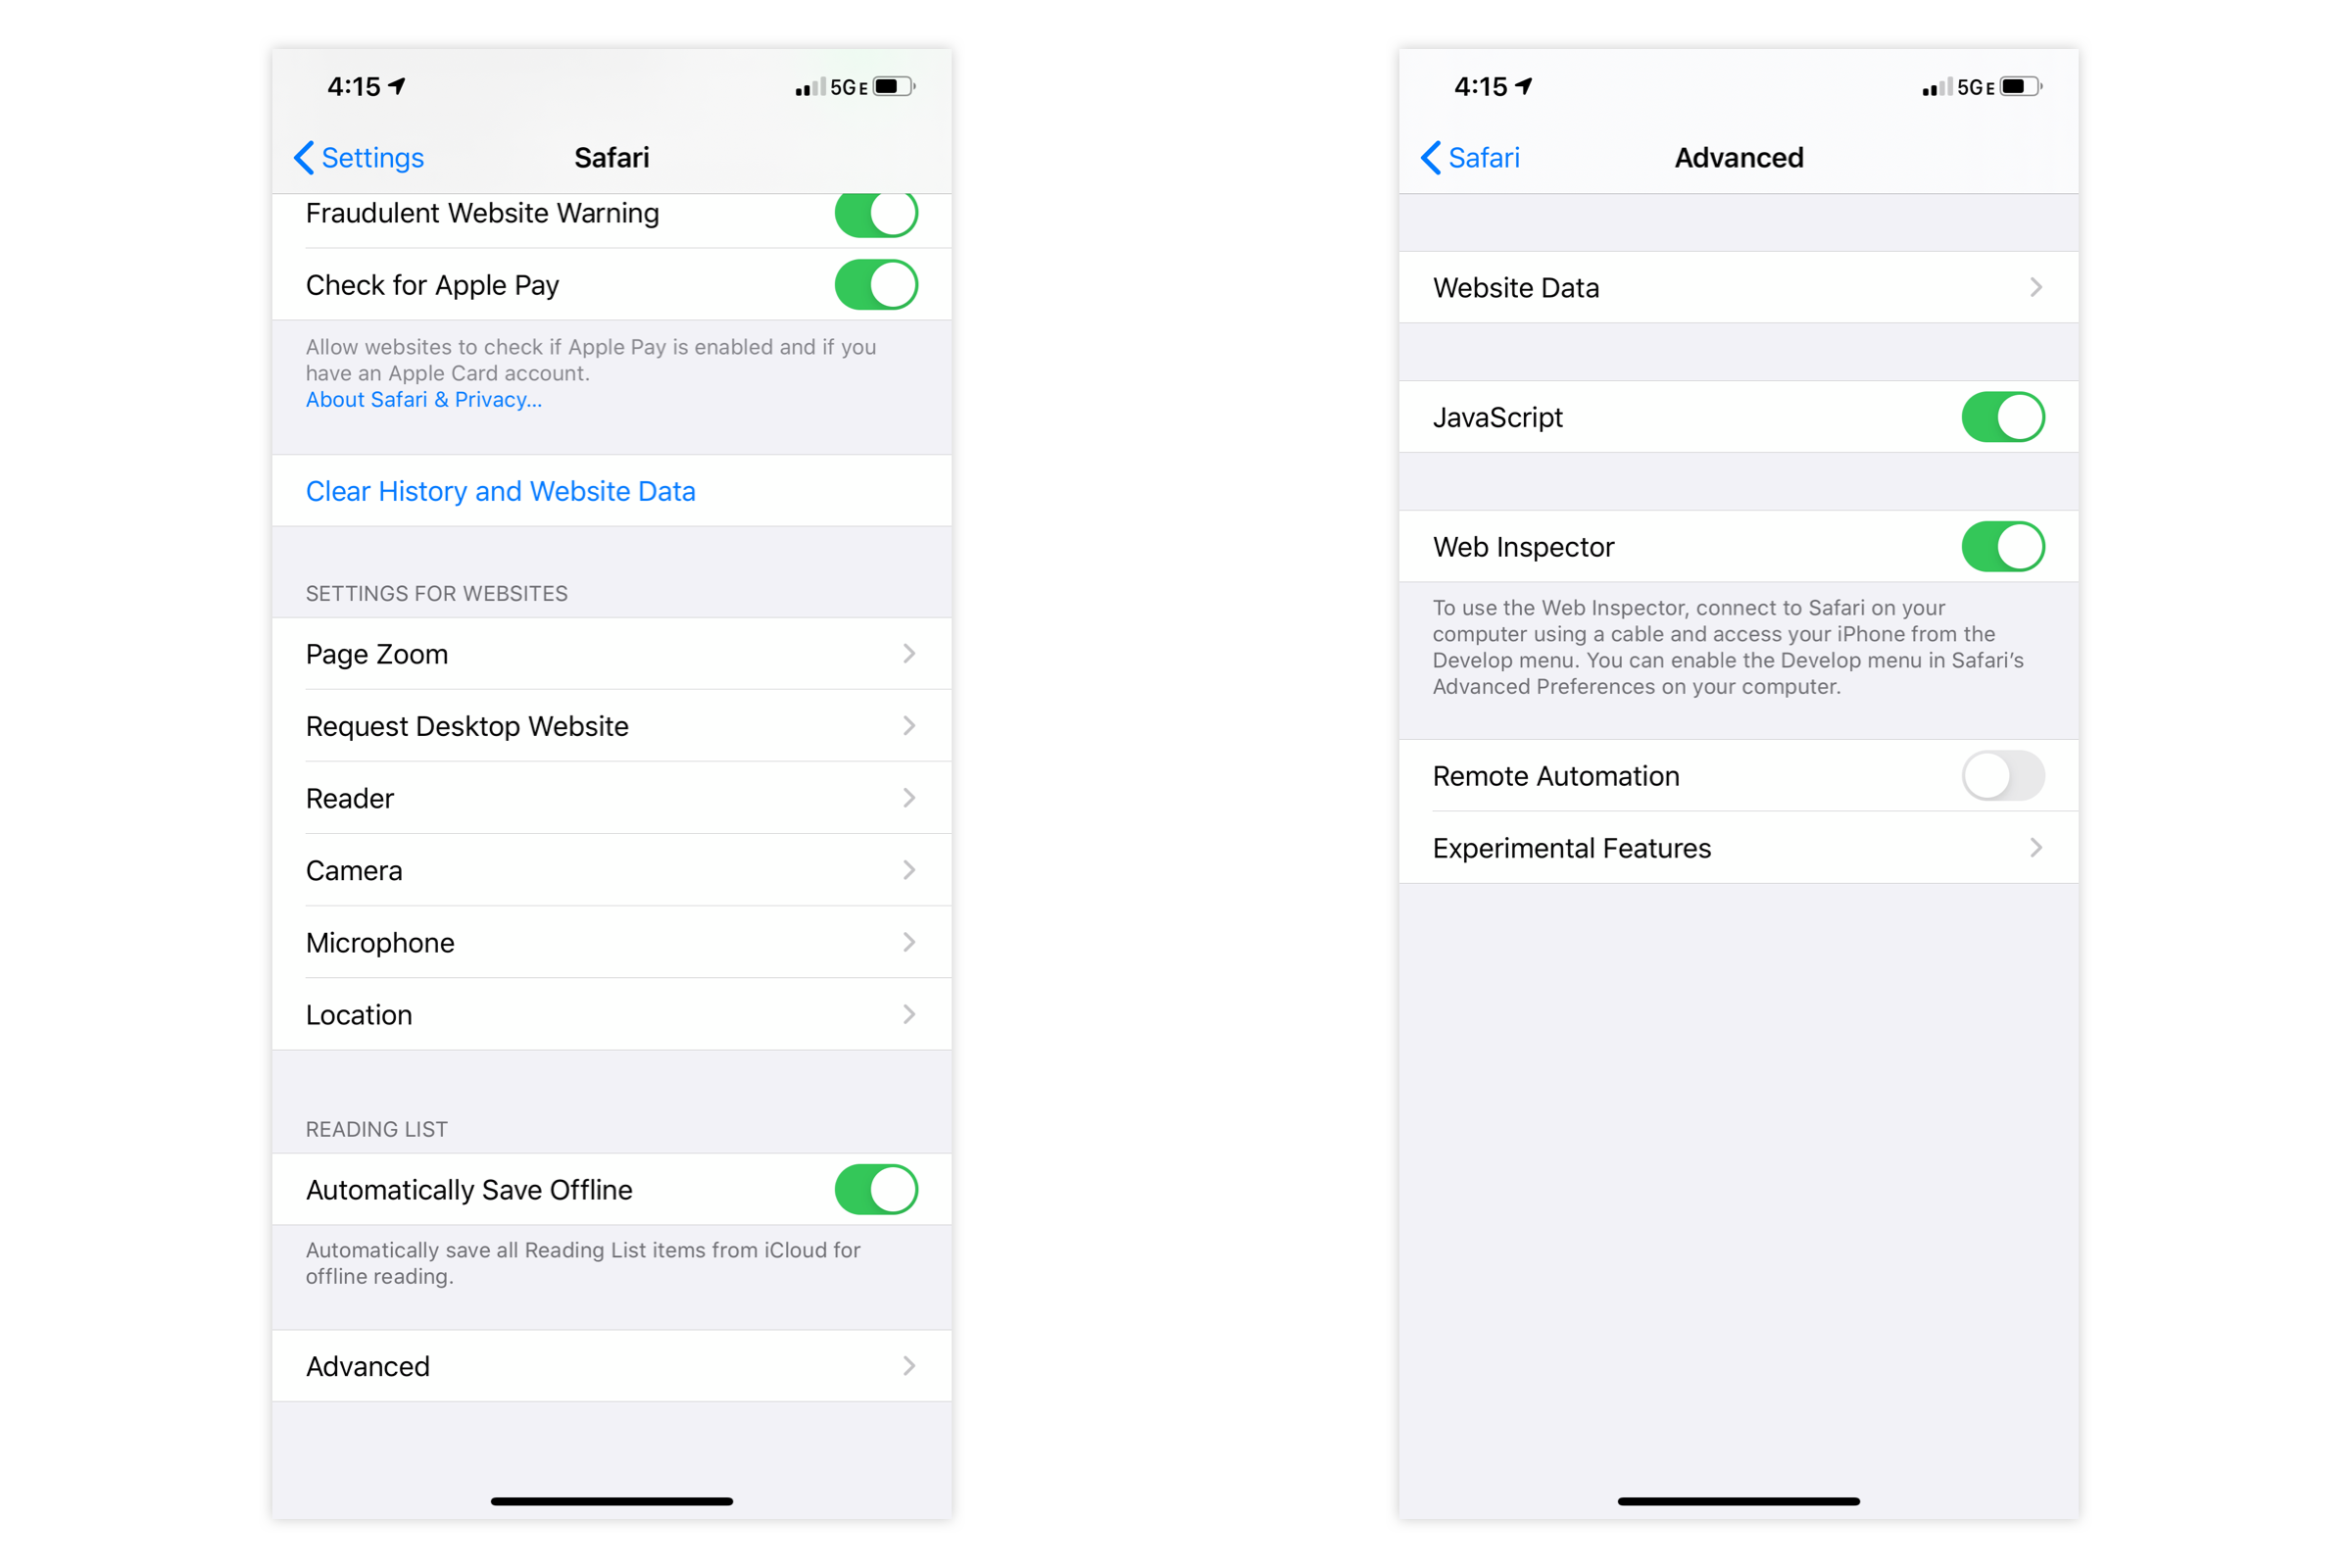
- If you want to use this on an actual device you’ll first need to enable the Web Inspector on iOS. To do this, go to the Settings app and then Safari > Advanced and toggle the Web Inspector on.
- Whilst the Web Inspector can interrogate WKWebView, it can only do this for apps you are running via Xcode. You cannot look at the WKWebView of apps you did not create nor of your own apps from TestFlight / the App Store. However, you can inspect debug builds installed via Xcode even if the debugger is not active (i.e. you build to the device then quit Xcode).
- Conversely, you can use the Web Inspector with any SFSafariViewController even if it is not in your own app.
- Whilst it is still possible to submit apps that use UIWebView, the web inspector will not work with them; it needs to be WKWebView .
- This also works for AppKit, SwiftUI, and Catalyst apps on macOS.
I use an “iDod” naming prefix for all of my devices; a throwback pun to my first Apple product, the iPod. ↩︎
May 28, 2020 Grant Isom

Using Safari to Inspect Web Views in iOS Simulators & Devices
This week I wanted to talk about how to use Safari’s Developer Tools with Simulators or iOS devices in Safari or in your application’s web views. This is something that can be extremely helpful when working in web applications or in apps that have a mixture of web and native content as do ours at Cerner.
Enabling Safari Debugging If you are on a real device you will need to enable the Web Inspector first. Open Settings, then open Safari, scroll to the bottom and open Advanced. You should see an option for Web Inspector, enable this and you will see your phone as an option in the Develop menu item.
If you are using a simulator, there is no setup after enabling the Develop mode in Safari.
Enabling the Develop Menu Item In Safari you will need to enable the Develop menu item before you can see any other available devices for inspection. Open Preferences ⌘ + , and open the Advanced section. At the bottom, check the box next to “Show Develop menu in menu bar”. Now you should see the Develop menu item and can chose web views or browser tabs to inspect on real devices or simulators!

You are now all set! You can interact with the web inspector just like you can in Desktop Safari. The only caveat is that this will not work for apps that are from TestFlight or the App Store, so debug mode only. Hope this helps and happy coding!

Debug iOS Safari with Xcode Simulator and Web Inspector
- Published: 15 Jun 2020
Uses: Xcode simulator
How I debug CSS for iOS Safari on my MacBook Pro.
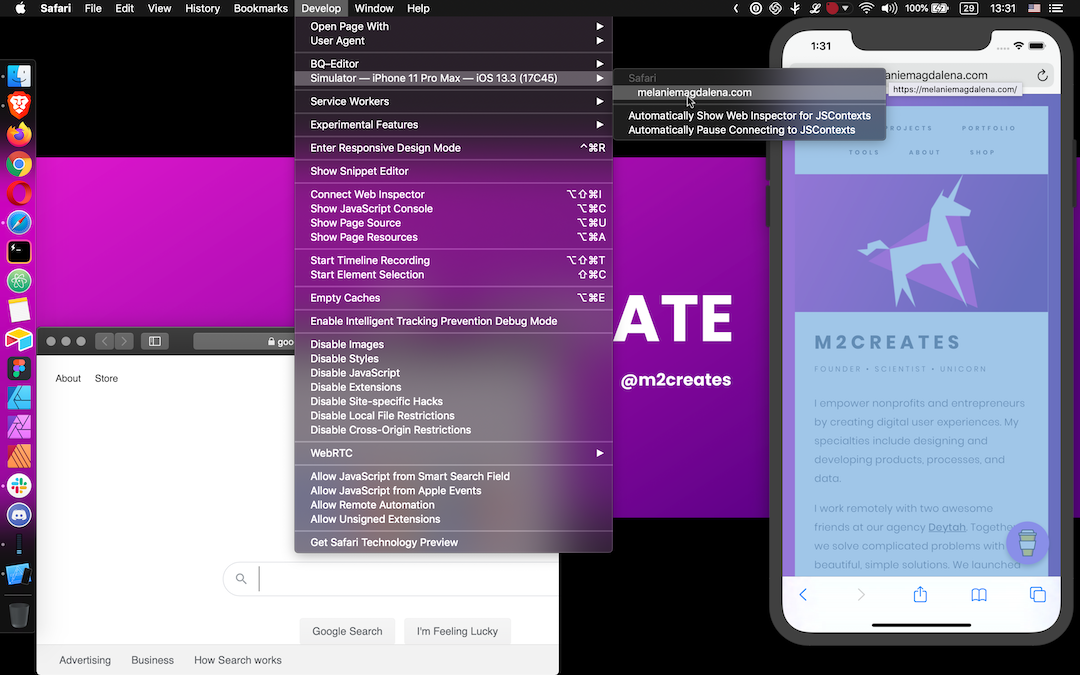
If you're like me and don’t have an iOS device, you can use Xcode Simulator to view and debug mobile Safari from your Mac.
Why would you need to simulate mobile Safari? Phones in general don't even have web inspectors for debugging. Have you ever had a CSS quirk on an iPhone and no iPhone to test with? I have.
As a lifelong Android user and web designer by trade, I regularly need to preview, test, or fix things for iOS Safari. Thankfully my MacBook has a way to simulate iOS devices so that I can preview and debug mobile Safari! Likewise, it can simulate older and newer iOS versions if needed.
The following steps may vary for newer and older versions of macOS, Xcode, and Safari. This guide uses:
- MacBook Pro (Retina, 15-inch, Mid 2015)
- macOS Mojave version 10.14.6
- Xcode version 11.3.1
- Safari version 13.1.1
Step 1: Open Xcode and Launch Simulator
From your Applications, launch Xcode. (Optionally, update Xcode if it yells at you when you try to open it.)
Once Xcode opens, navigate to Open Developer Tool > Simulator from the Mac toolbar.
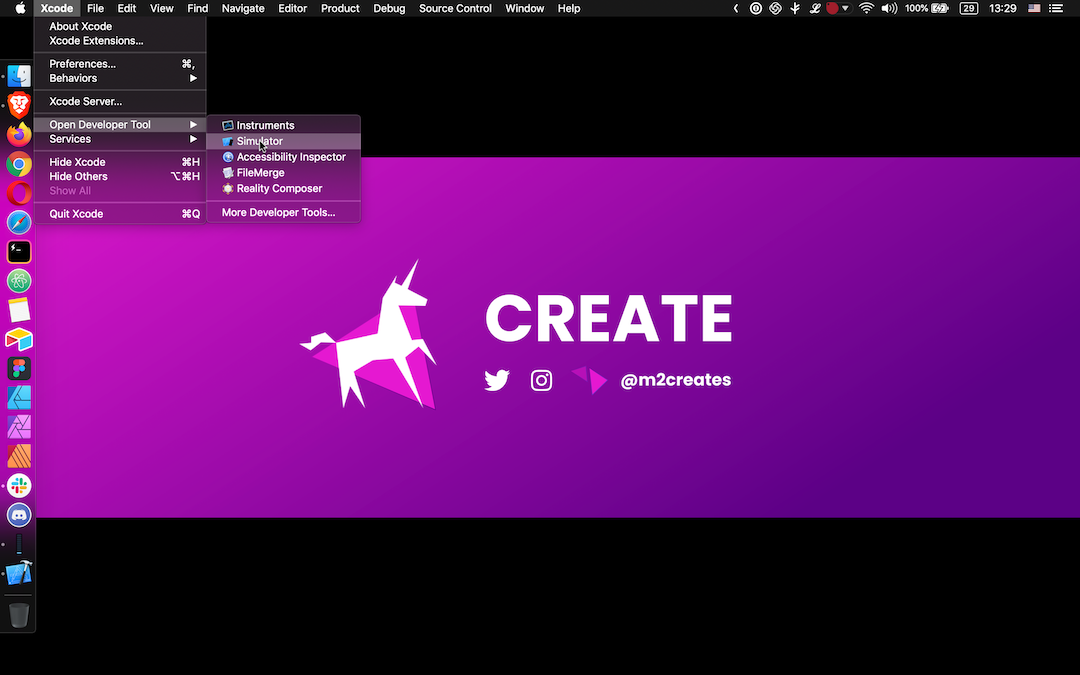
If you’re a Spotlight user (which I am not), just search for Simulator and bypass launching Xcode altogether.
Step 2: Adjust the Simulator
A simulated device should pop up on your screen and begin loading. From the Mac toolbar, you can adjust the simulator via Hardware > Devices and select the OS and Device. You can pick from various iPhones and iPads in the iOS dropdown.
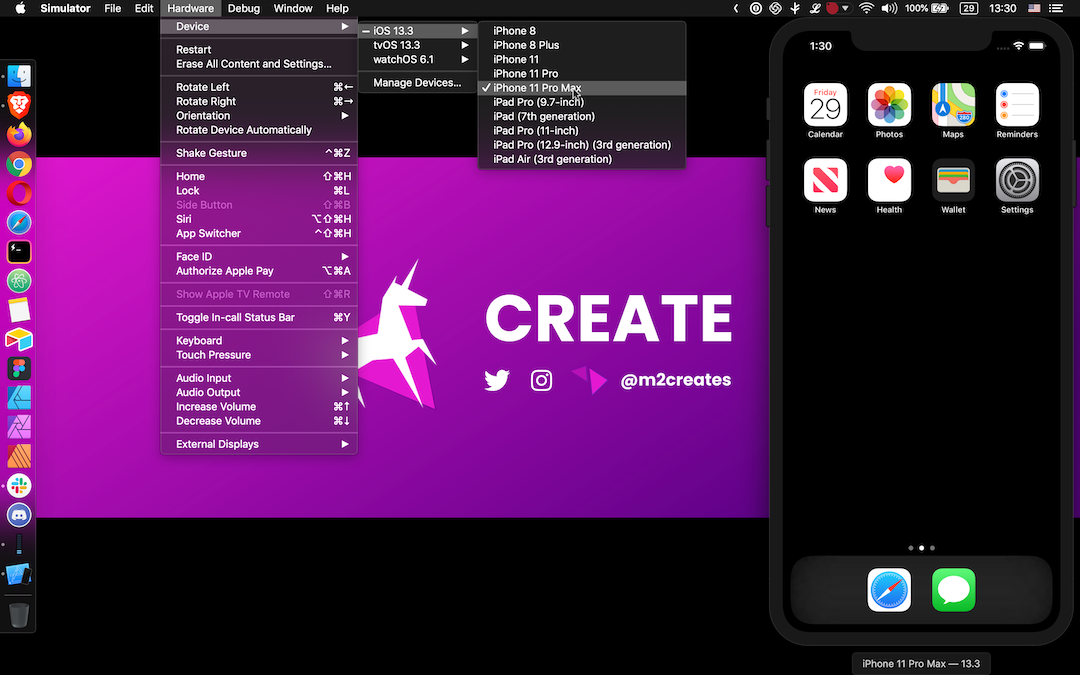
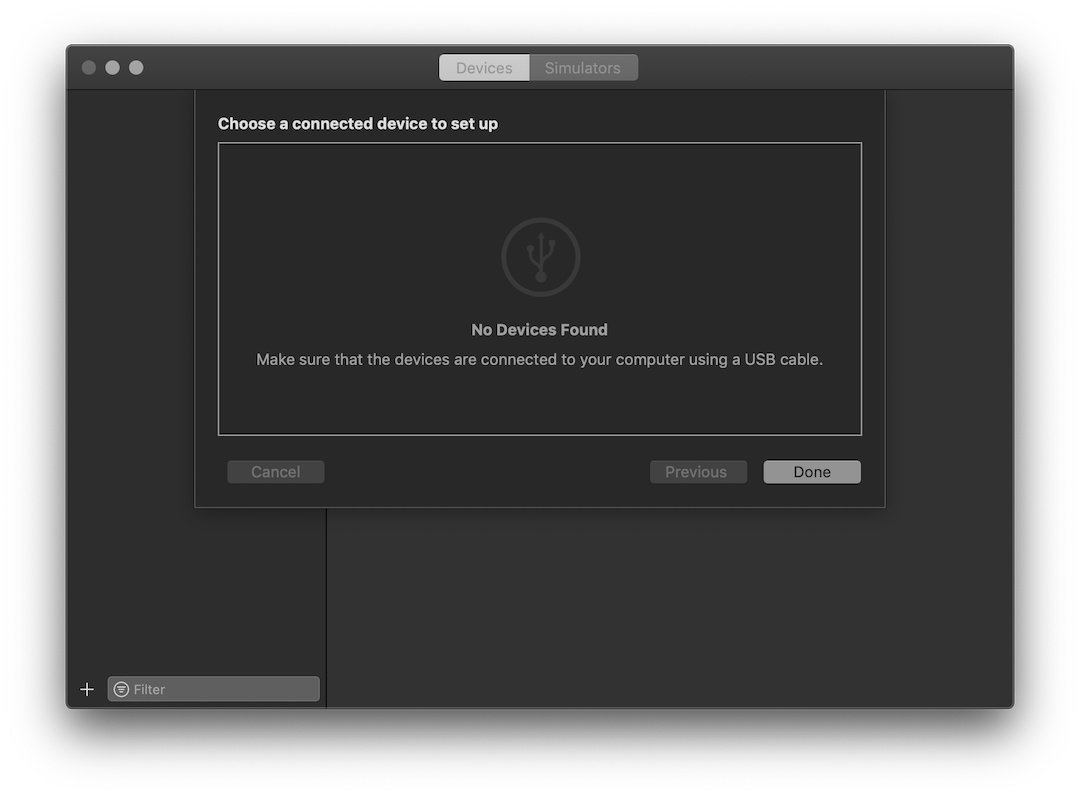
If you need something different, select Manage Devices for a suite of additional options:
Under Devices, add a device connected through USB.
Under Simulators, add a new simulator by selecting a device and iOS version (or install an additional iOS version runtime).
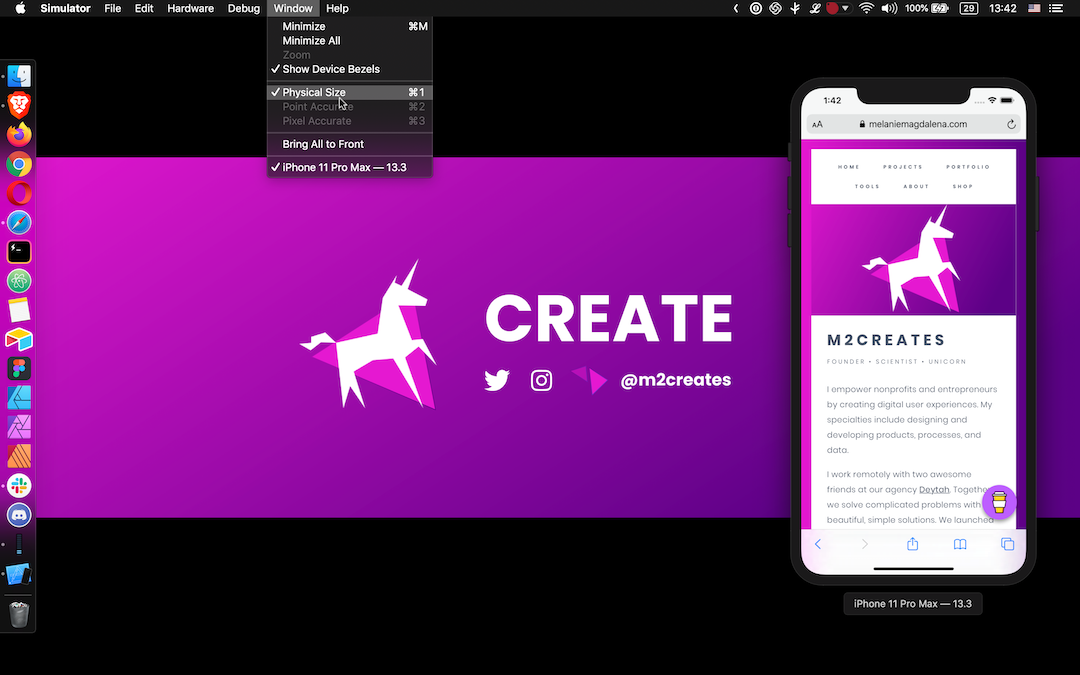
You can choose to use the simulation at the actual device size (instead of your screen's full height). Assign it via the Mac toolbar under Window to Physical Size.
Step 3: Simulate iOS Safari
In the Simulator, open up mobile Safari. Navigate to the appropriate page you’d like to interact with via Safari Web Inspector.
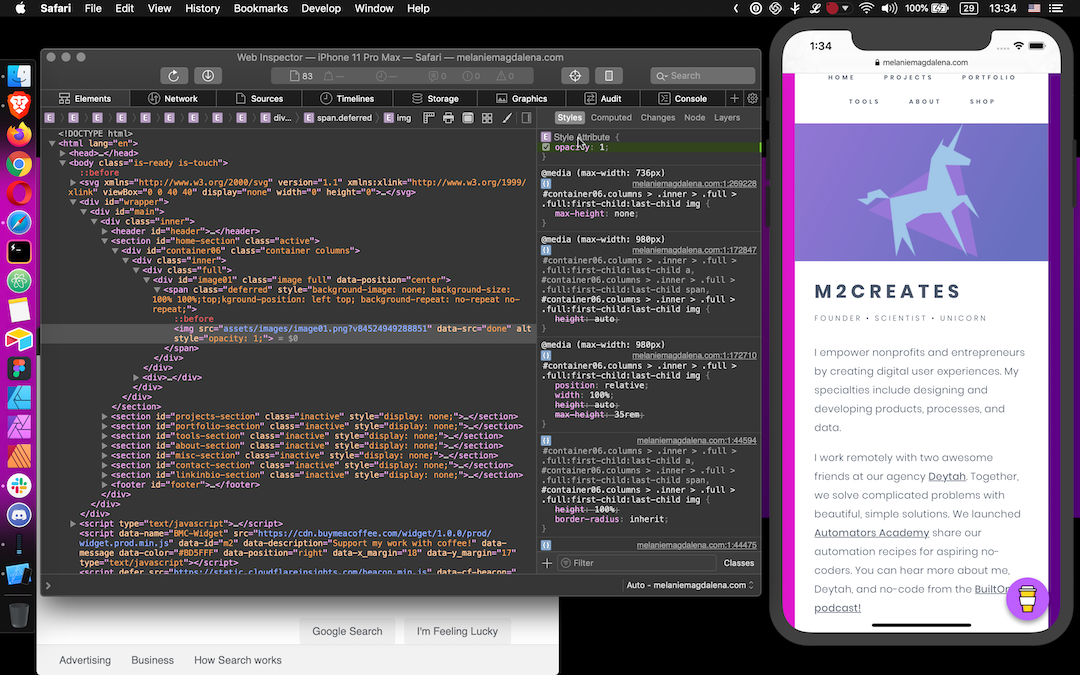
On your Mac, open up Safari. In the Mac toolbar under Develop , select the Simulator option beneath your device’s name. Pick the iOS Safari tab loaded in the Simulator. Web Inspector will launch to start debugging mobile Safari!

Step 4: Use Web Inspector to Debug Mobile Safari
Now you can go about your business and hopefully resolve whatever brought you down this rabbit hole to begin with. Debug mobile Safari just like you normally would for desktop Safari.
Additional Resources
Need more help?
- Visit Apple's Simulator Help
- Visit Apple's Safari Developer Help
Other guides that may be helpful:
- Debugging Your iPhone Mobile Web App With Safari Dev Tools by Matthew Croak on Medium [Premium Article]
- How to Use Web Inspector to Debug Mobile Safari (iPhone or iPad) by SK on Apple Toolbox
Simulator Bonuses
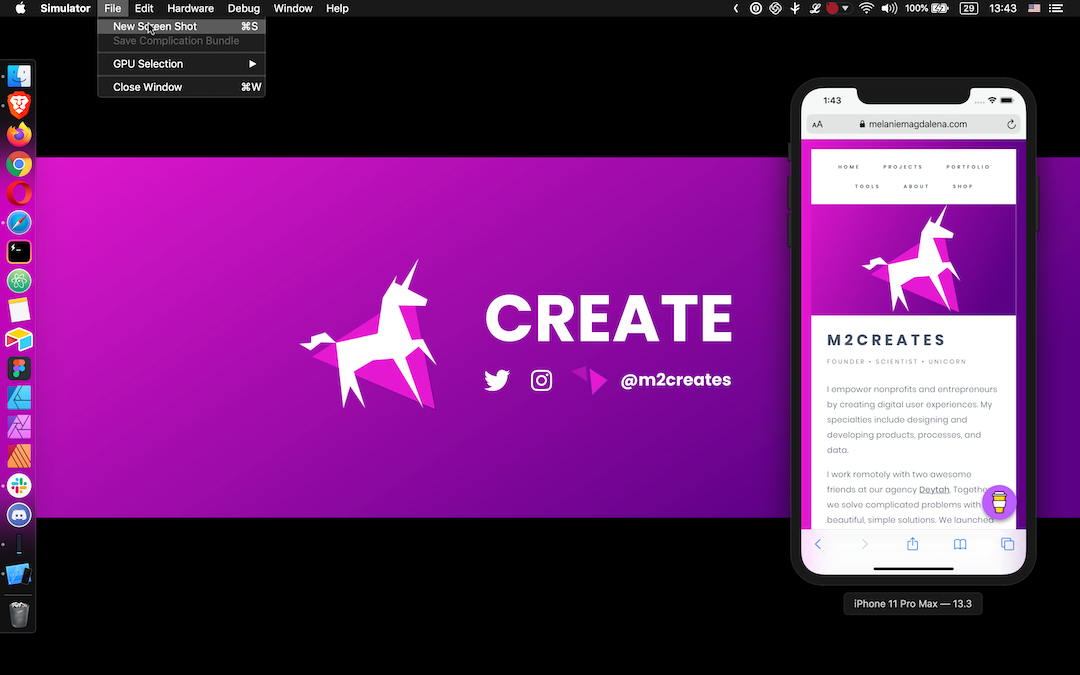
In the Simulator, from the Mac toolbar under File you can take a New Screen Shot , or use CMD+S.
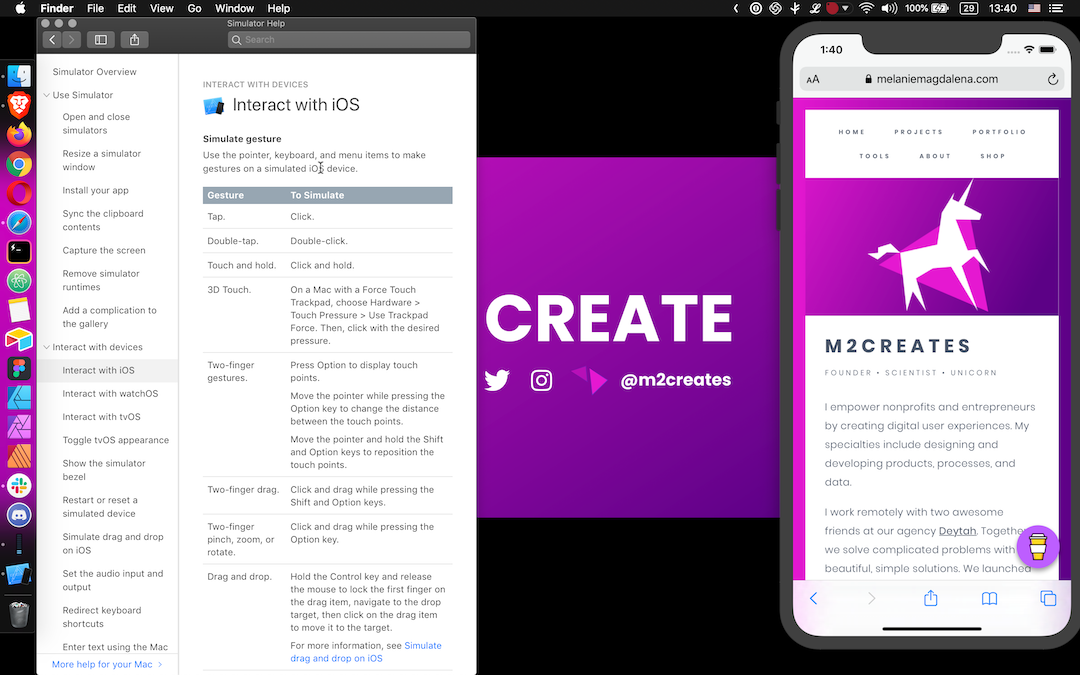
For a how-to on more features and functionality offered in the Simulator, browse the Help section. I kind of want a Force Touch track pad now...
- Written by Melanie E Magdalena
Tags: # debugging
Thanks for reading! If this helped or you learned something, Buy Me A Coffee.
How to debug WebViews on iOS devices with Inspect
Inspect can only debug web content in developer provisioned applications or applications with the com.apple.webinspector.allow entitlement
Which WebView types are supported on iOS?
This is a limitation from Apple, and something Inspect can't change. See https://webkit.org/web-inspector/enabling-web-inspector/ for details.
How to get started?
Follow our getting started guide to get going.
- Which WebView types are supported on iOS?
- How to get started?
Web Inspector Reference Enabling Web Inspector
Ios simulator.
To enable Web Inspector in Safari (or Safari Technology Preview ):
- click the Safari (or Safari Technology Preview ) menu bar item
- select Preferences… (or press ⌘ , )
- go to the Advanced pane
- check the Show Develop menu in menu bar checkbox
Show Web Inspector (or pressing ⌥ ⌘ I ) in the Develop menu or by right-clicking on any page in Safari (or Safari Technology Preview ) and selecting Inspect Element .
Once Web Inspector is enabled, the name of the current the macOS machine will appear as a submenu in the Develop menu of Safari (or Safari Technology Preview ), allowing for inspection of:
To enable remote inspection on an iOS device:
- open the Settings app
- go to Safari
- scroll down to Advanced
- enable the Web Inspector toggle
Once Web Inspector is enabled, connecting the iOS device to any macOS machine, either via a physical cable or after configuring wireless debugging in Xcode , the name of the iOS device will appear as a submenu in the Develop menu of Safari (and Safari Technology Preview ) on the connected macOS machine, allowing for remote inspection of:
- any page in Safari
- websites added to the home screen
- SFSafariViewController
NOTE : in order to use remote inspection, Web Inspector must be enabled on the connected macOS machine.
Remote inspection is always enabled for iOS simulators, meaning they will also appear in the Develop menu of Safari (and Safari Technology Preview ) just like connected iOS devices.
Automatic Inspection
At the bottom of any macOS machine or iOS device submenu in the Develop menu of Safari (or Safari Technology Preview ), there are two toggles:
- Automatically Show Web Inspector for JSContexts controls whether Web Inspector is automatically opened whenever a JSContext is created by any inspectable application on the corresponding macOS machine or iOS device.
- Automatically Pause Connecting to JSContexts controls whether Web Inspector automatically pauses JavaScript execution when inspecting any JSContext on the corresponding macOS machine or iOS device.

Written June 8, 2020 by Brian Burg , Devin Rousso , Joseph Pecoraro , and Timothy Hatcher
Last updated September 8, 2020 by Devin Rousso
Livestreams
Lite mode on
Quick links
Suggested search
Debug Performance in a WebView
Add to favorites
Enable Safari's WebInspector to debug the performance of a WebView in your application

SwiftUI Advanced Handbook
Firebase Auth
Read from Firestore
Write to Firestore
Join an Array of Strings
Data from JSON
HTTP Request
Code Highlighting in a WebView
Test for Production in the Simulator
Debug a Crash Log
Simulate a Bad Network
Archive a Build in Xcode
Apollo GraphQL Part I
Apollo GraphQL Part 2
Apollo GraphQL Part 3
Configuration Files in Xcode
ImagePicker
Compress a UIImage
Firebase Storage
Search Feature
Push Notifications Part 1
Push Notifications Part 2
Push Notifications Part 3
Network Connection
Download Files Locally Part 1
Download Files Locally Part 2
Offline Data with Realm
HTTP Request with Async Await
Xcode Cloud
SceneStorage and TabView
Network Connection Observer
Apollo GraphQL Caching
Create a model from an API response
Multiple type variables in Swift
Parsing Data with SwiftyJSON
Firebase Remote Config
Enable Develop Menu
Open Safari and make sure the Develop menu is enabled.
If you don't see the Develop menu, click on Safari > Preferences > Advanced > Show Develop Menu in menu bar. A shortcut to access the Preferences menu in Safari is Command (⌘) + , .
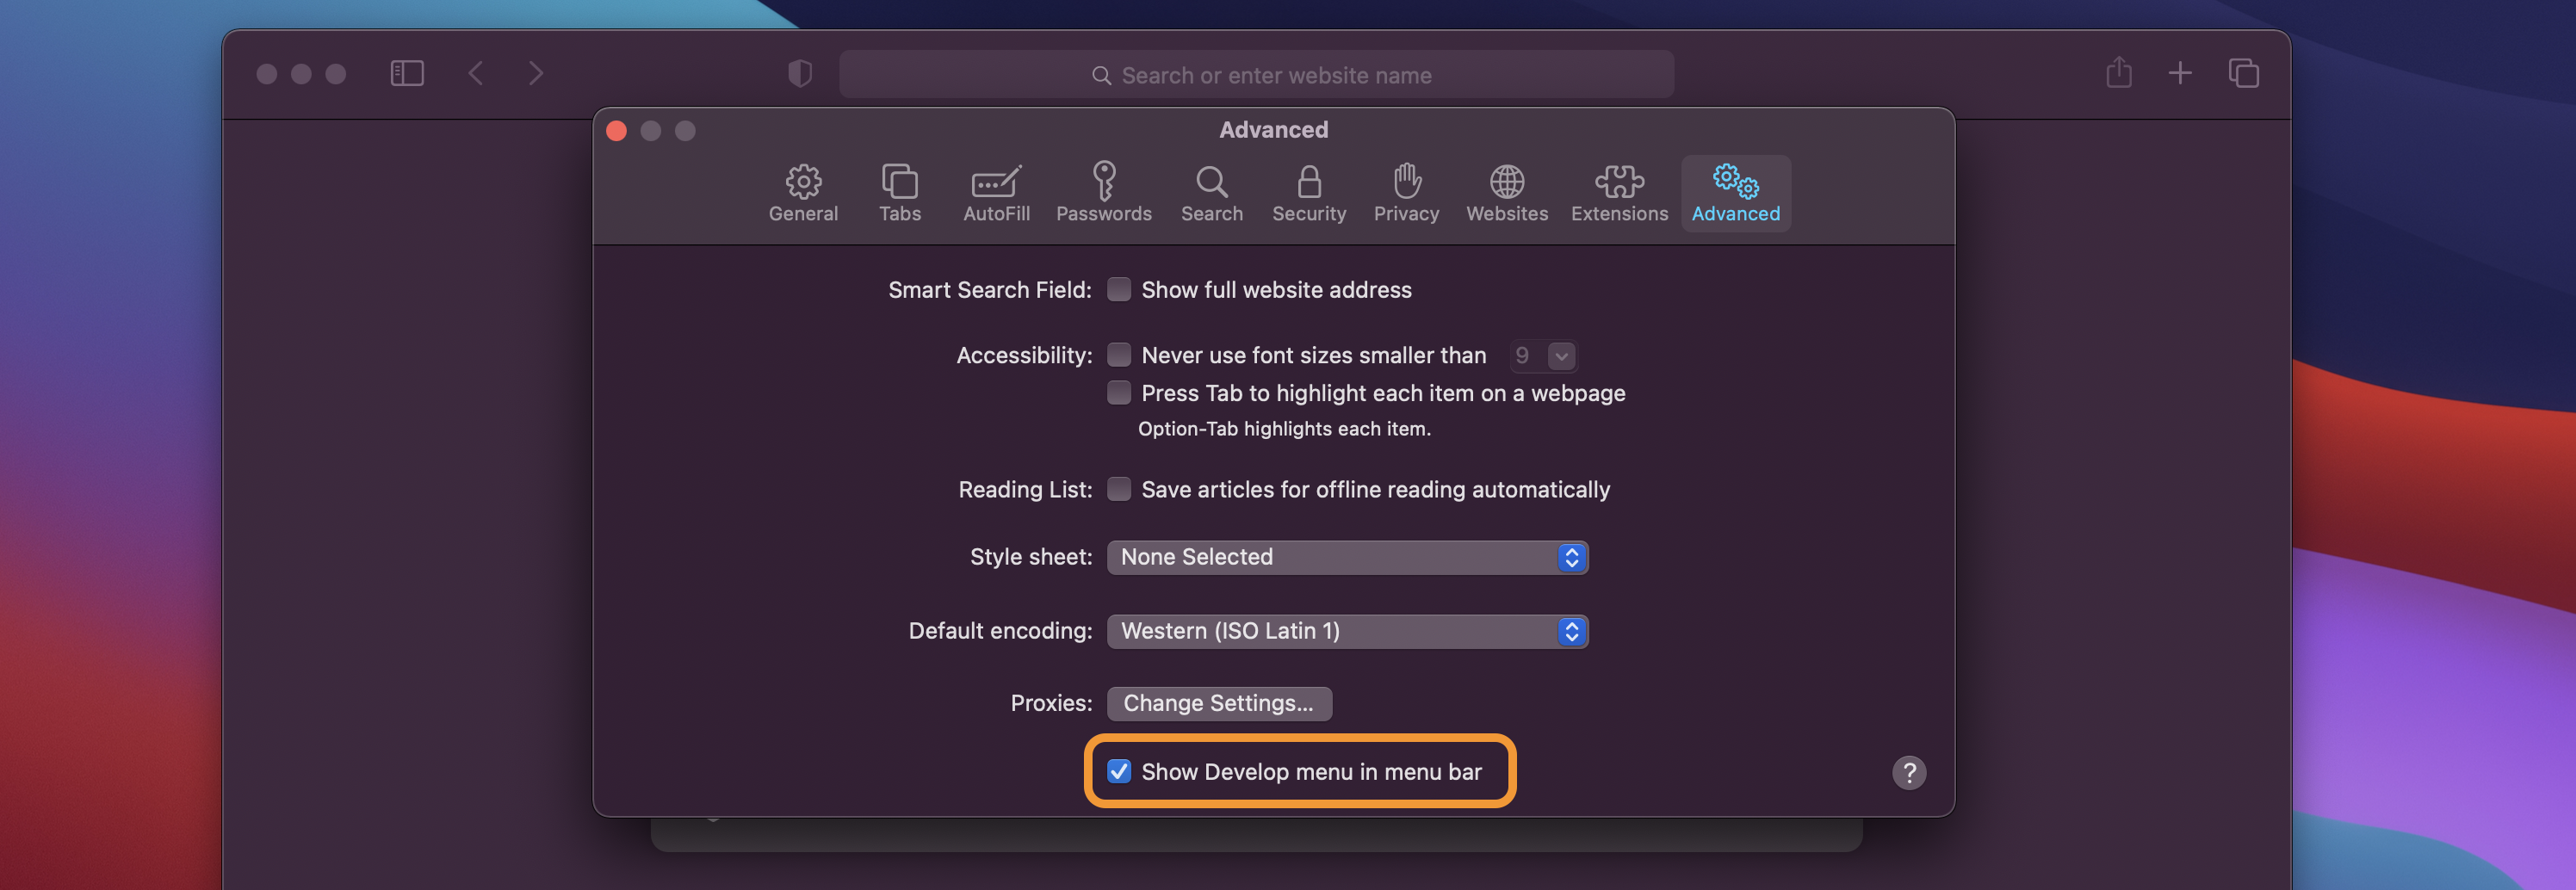
You can also do the same on your device by going into Settings > Safari > Advanced > Enable Web Inspector .
Open your device
Open the device or the Simulator on which you want to debug the performance issues.
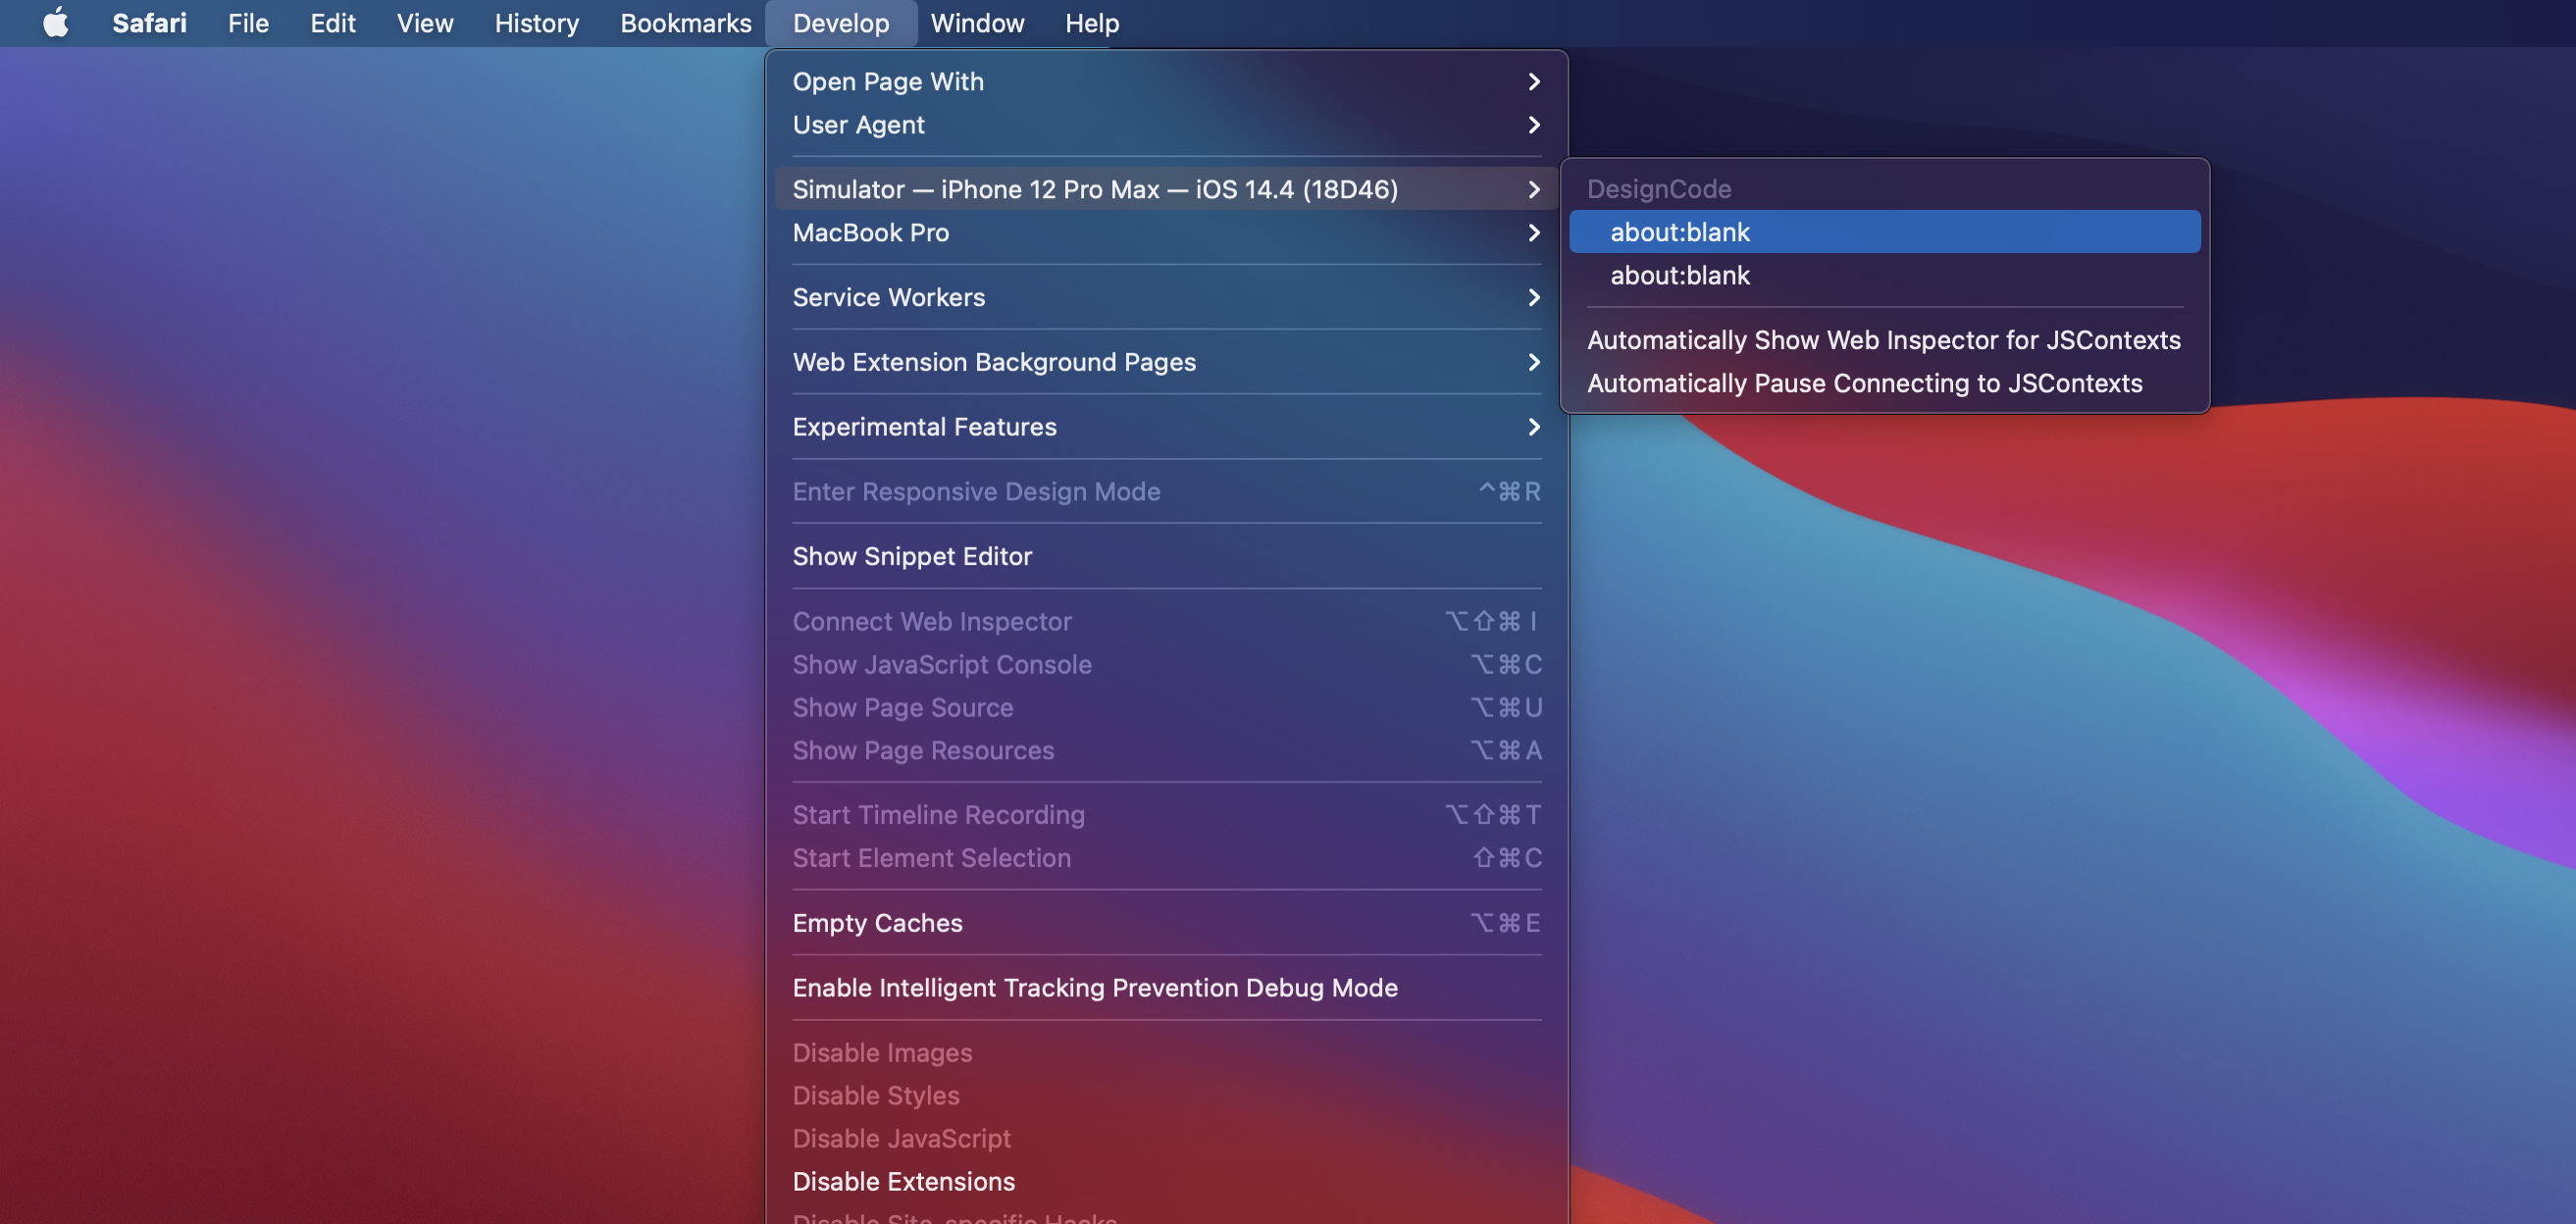
Go back to Safari and click on Develop in the top menu. There, you'll see all the available devices. Choose the one you're working with and select the WebView you wish to debug.
Track your performance
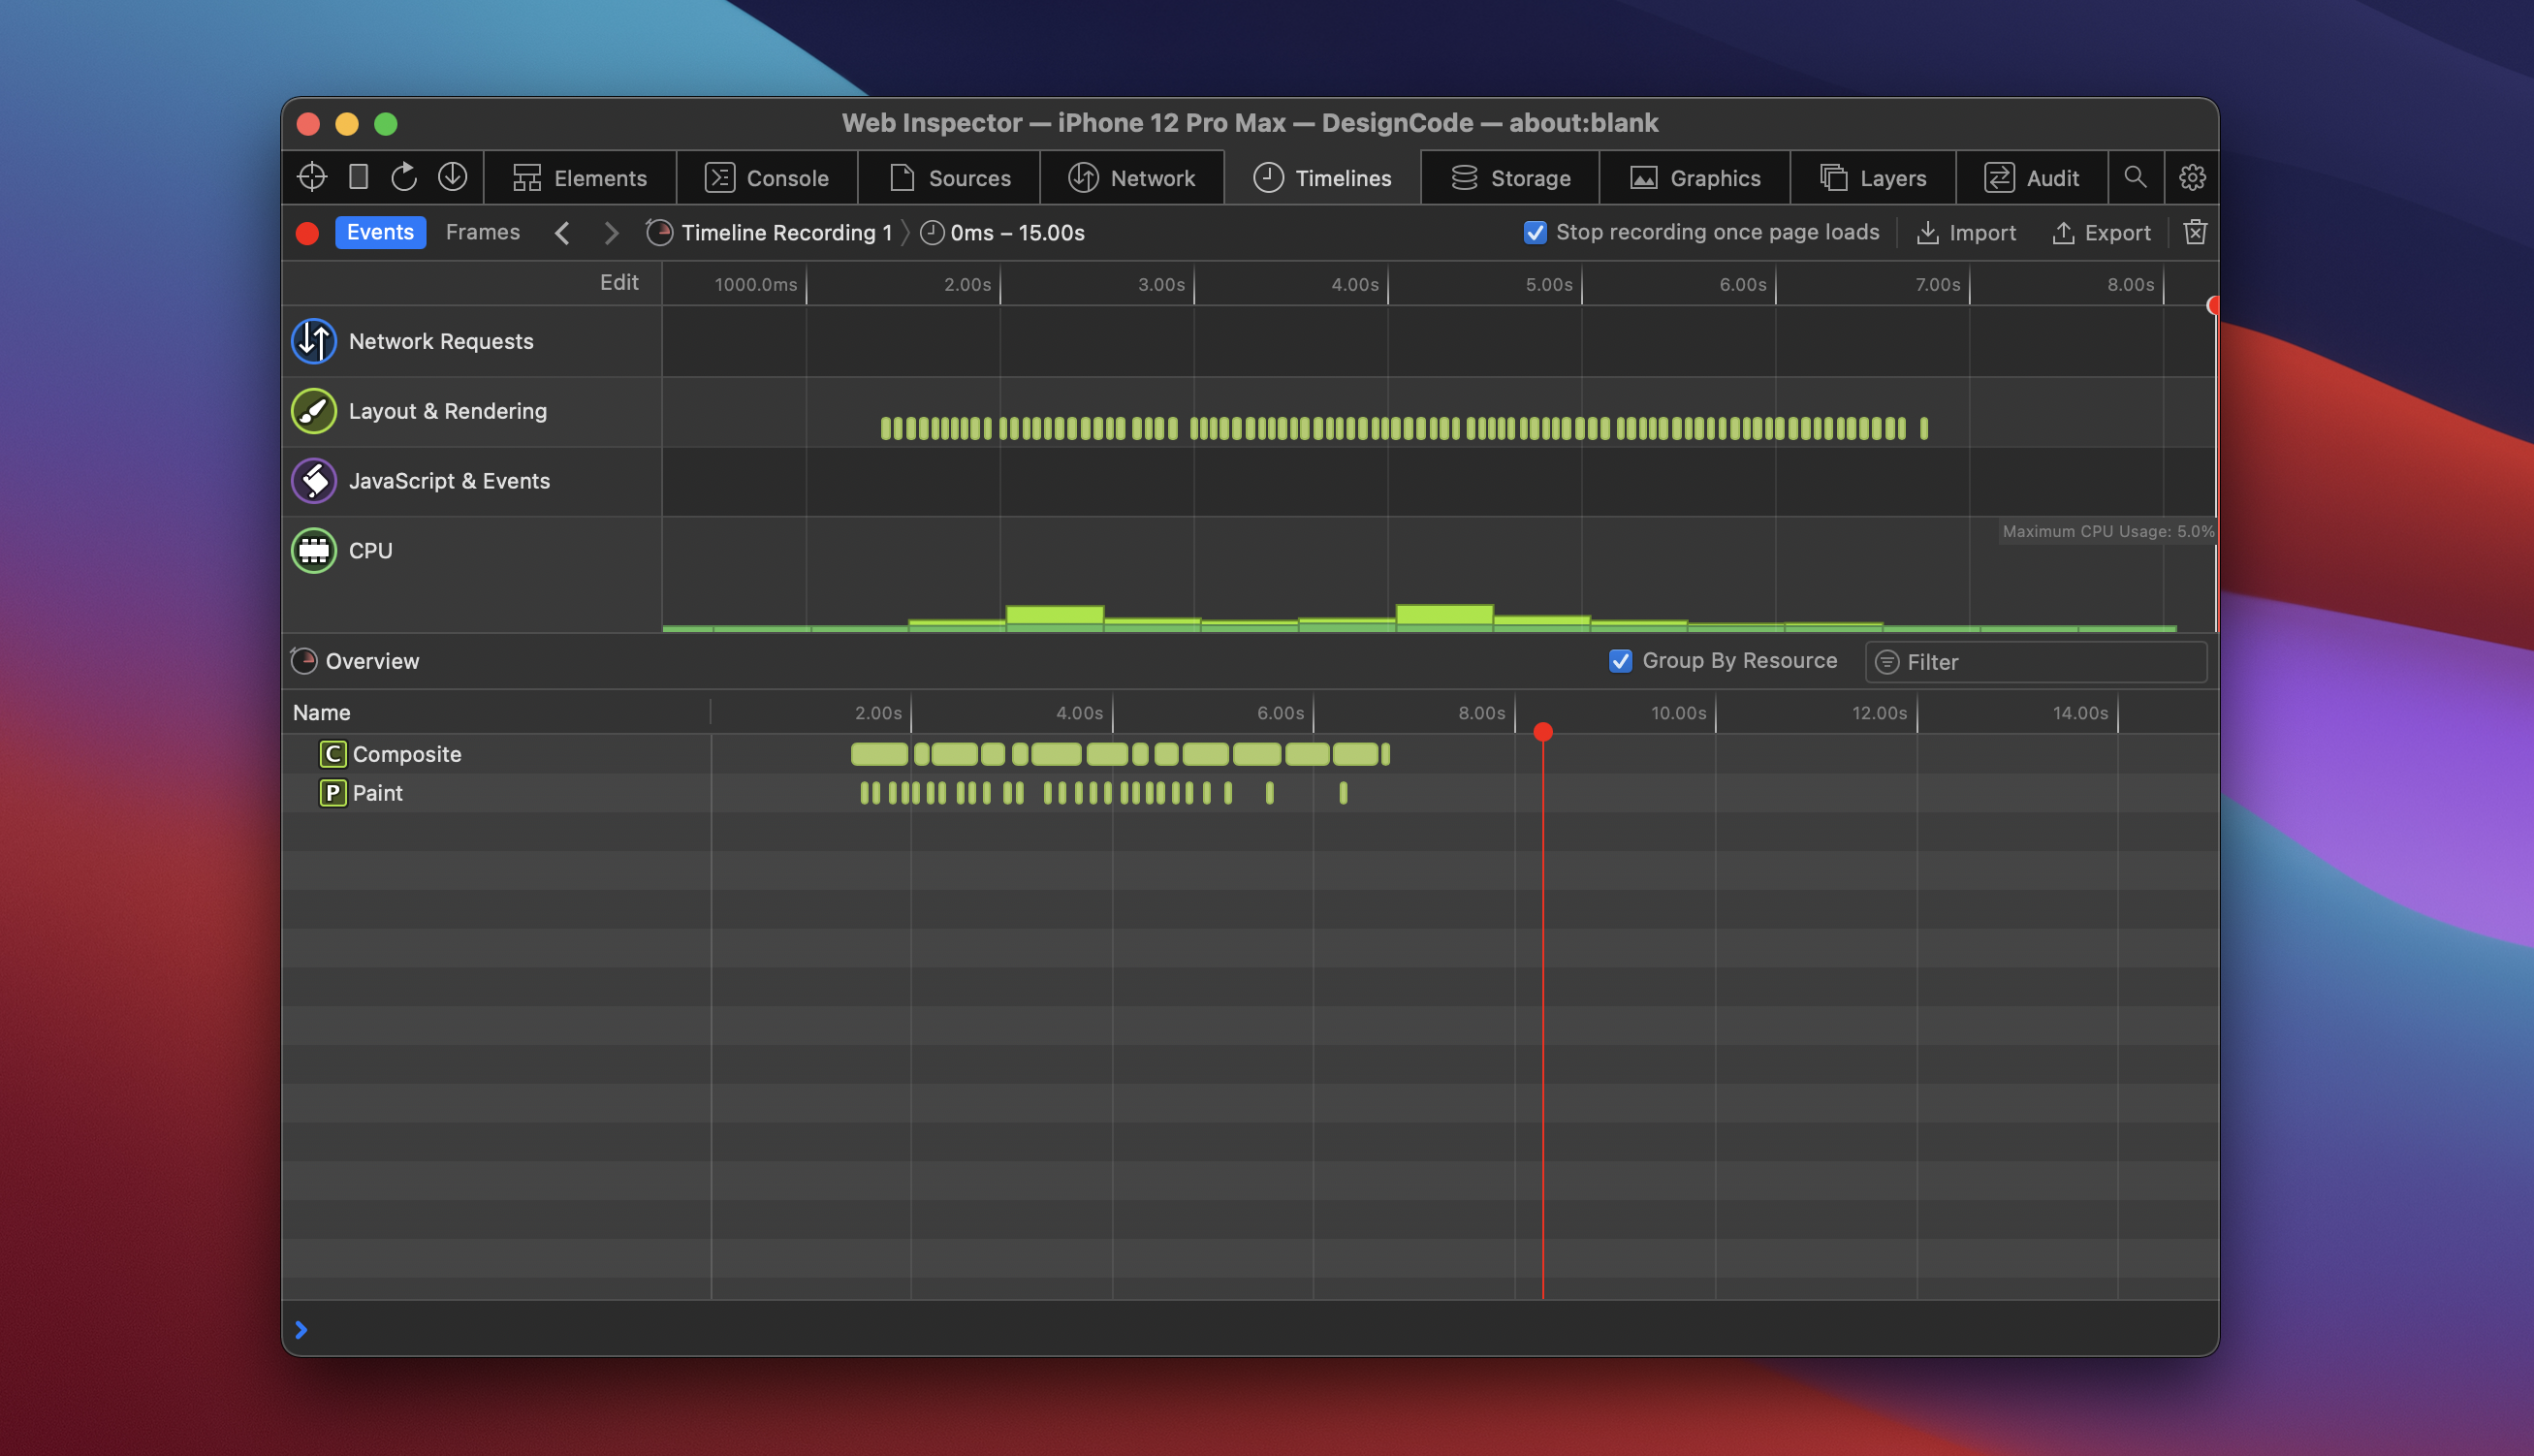
The Web Inspector will open and you'll be able to record the performance of your WebView . All the events happening while you were using your app will be recorded, as well as all the frames per seconds rendered.
To learn more about Web Inspector, you can read Apple's documentation .
Learn with videos and source files. Available to Pro subscribers only.
Get Pro Access
$19 per month
Purchase includes access to 50+ courses, 320+ premium tutorials, 300+ hours of videos, source files and certificates.
Templates and source code
Download source files
Download the videos and assets to refer and learn offline without interuption.
Design template
Source code for all sections
Video files, ePub and subtitles
How to install Firebase authentification to your Xcode project
Install Cloud Firestore in your application to fetch and read data from a collection
Save the data users input in your application in a Firestore collection
Turn your array into a serialized String
Load data from a JSON file into your SwiftUI application
Create an HTTP Get Request to fetch data from an API
Integrate an HTML page into your SwiftUI application using WKWebView and by converting Markdown into HTML
Use Highlight.js to convert your code blocks into beautiful highlighted code in a WebView
Build your app on Release scheme to test for production
Learn how to debug a crash log from App Store Connect in Xcode
Test your SwiftUI application by simulating a bad network connection with Network Link Conditionner
Archive a build for beta testing or to release in the App Store
Install Apollo GraphQL in your project to fetch data from an API
Make a network call to fetch your data and process it into your own data type
Display the data fetched with Apollo GraphQL in your View
Create configuration files and add variables depending on the environment - development or production
Request an app review from your user for the AppStore
Create an ImagePicker to choose a photo from the library or take a photo from the camera
Compress a UIImage by converting it to JPEG, reducing its size and quality
Upload, delete and list files in Firebase Storage
Implement a search feature to filter through your content in your SwiftUI application
Set up Firebase Cloud Messaging as a provider server to send push notifications to your users
Create an AppDelegate to ask permission to send push notifications using Apple Push Notifications service and Firebase Cloud Messaging
Tie everything together and test your push notifications feature in production
Verify the network connection of your user to perform tasks depending on their network's reachability
Download videos and files locally so users can watch them offline
Learn how to use the DownloadManager class in your views for offline video viewing
Save your SwiftUI data into a Realm so users can access them offline
Create an HTTP get request function using async await
Automate workflows with Xcode Cloud
Use @SceneStorage with TabView for better user experience on iPad
Observe the network connection state using NWPathMonitor
Cache data for offline availability with Apollo GraphQL
Learn how to create a SwiftUI model out of the response body of an API
Make your models conform to the same protocol to create multiple type variables
Make API calls and easily parse data with this JSON package
Build a simple Shazam clone and perform music recognition
Deliver changes to your app on the fly remotely
Meet the instructor
We all try to be consistent with our way of teaching step-by-step, providing source files and prioritizing design in our courses.
Stephanie Diep
iOS and Web developer
Developing web and mobile applications while learning new techniques everyday
7 courses - 35 hours

Build Quick Apps with SwiftUI
Apply your Swift and SwiftUI knowledge by building real, quick and various applications from scratch

Advanced React Hooks Handbook
An extensive series of tutorials covering advanced topics related to React hooks, with a main focus on backend and logic to take your React skills to the next level

SwiftUI Concurrency
Concurrency, swipe actions, search feature, AttributedStrings and accessibility were concepts discussed at WWDC21. This course explores all these topics, in addition to data hosting in Contentful and data fetching using Apollo GraphQL
SwiftUI Combine and Data
Learn about Combine, the MVVM architecture, data, notifications and performance hands-on by creating a beautiful SwiftUI application

An extensive series of tutorials covering advanced topics related to SwiftUI, with a main focus on backend and logic to take your SwiftUI skills to the next level
React Hooks Handbook
An exhaustive catalog of React tutorials covering hooks, styling and some more advanced topics

SwiftUI Handbook
A comprehensive series of tutorials covering Xcode, SwiftUI and all the layout and development techniques
Site made with React, Gatsby, Netlify and Contentful. Learn how .
Design+Code © 2024
Need help? Contact Us

DEV Community
Posted on Jul 29, 2021

How to debug React Native WebView
Assuming that you have already started working with React Native and possibly began to check how to debug code in and out using the debug menu in devices. Keeping aside the traditional code and bringing focus on the WebView component only. Recently, React Native Dev made some changes in the web view repo and replaced UIWebView with WKWebView in iOS 8.0. Then the next change happened, if you are reading this, then you probably must know this, React Native removed WebView from its repository and made it a self-supported import. Now it exists in,
React Native Web View
Now, coming back to the main agenda of debugging HTML in iOS and Android devices.
For iOS We need probably two things, an app running in any iOS device/iOS simulator with the app in debug state and Safari Developer Toolkit.
To enable "Develop" mode in Safari Browser:
- Open Safari Browser
- Under the Safari option, click on 'Preferences'
- Under the 'Advanced' tab, enable check "Show Develop menu in menu bar"
Steps for debugging:
- Run the React Native app with WebView in iOS device/ iOS simulator in debug mode
- Open Safari, from the menu bar, we need to click on 'Develop' option, 'Develop' > {Device Name} > {Application Name} > {Title}
- Now you can debug the HTML rendered within the WebView
For Android We can debug the contents of the WebView in Chrome directly.
- Firstly, we need to make some edits in the "MainApplication.java" file so that we can enable debugging, see below-attached image for importing

- Run the React Native app with WebView in Android device or Android emulator
- Open Chrome, and follow the links, DevTools > 3 dot menu > More tools > Remote devices
- Select the current device and then hit 'Inspect'
- Now you can debug the HTML content of the WebView
Note: USB debugging must be enabled in your device settings.
I was stuck at debugging the content for a while and then I referred this link . I hope it'll be a great help to you.
Happy Coding :)
Top comments (2)
Templates let you quickly answer FAQs or store snippets for re-use.
- Location Assam, India
- Work React Native at self-employed
- Joined Jun 1, 2020
Thanks for this guide, I was looking for the exact clarity. Please keep up the good work.
- Location Chandigarh, India
- Education Bachelors of Engineering in Computer Networking & Communications Technology
- Work Full Stack Developer at Matrix Marketers
- Joined Oct 28, 2020
@joweltisso Awesome! Sounds so good that it helped you.
Are you sure you want to hide this comment? It will become hidden in your post, but will still be visible via the comment's permalink .
Hide child comments as well
For further actions, you may consider blocking this person and/or reporting abuse

Levantando um SQL Server RDS em AWS
Bruno Caxias - Apr 24

AWS Under the Hood - Day 4
Prashant Lakhera - Apr 24

API Gateways in Zuplo – Creating an ASCII Art API
Dev Leader - Apr 24

Numeric Type Conversions
Paul Ngugi - Apr 24

We're a place where coders share, stay up-to-date and grow their careers.
- Web Hosting
- Customer Spotlights
- Design + Creative
- Web Development + Tech
- Work + Life
- Cloud Hosting
- Media Temple Updates
- Content Management System
- Browser Extensions
- AWS Security

Quick Tip: Debug iOS Safari on a True Local Emulator (or your actual iPhone/iPad)
I’m sure plenty of folks know this, but like literally anything else in the world, plenty of folks don’t. This is an incredibly handy feature of developing responsive sites and testing them on as real of devices as you can. Plus, it doesn’t cost anything additional beyond your macOS computer.
Step 1) Download Xcode
The iOS Simulator is an app that comes bundled with Xcode. Xcode is free and you get it from the app store .

Step 2) Open Simulator
It’s in the main Xcode menu at Open Developer Tool > Simulator.

It will be a new icon in your dock. I like to move it so that it stays an icon in my dock, and I don’t need to open Xcode again to find it and use it.

(^ It’s on the far right here.)
The window for the simulator is like a fake Apple device. You can simulate just about anything (Watch, AppleTV, iPad, etc) by going to Hardware > Device.

Step 3) Open Safari and go to a website
Easy enough to type something in. It understands keyboard input so you don’t have to like use the mouse to click fake on-screen keys.

Important trick! Often times you are pasting a URL into the address field. To do this, you’ll need to have the URL on your clipboard, activate the simulator, press ⌘-V to paste, then you can click to bring up the iOS paste menu and paste it. At least… that’s what you used to have to do. I just recently upgraded to Xcode 10 and it seems like you can simply ⌘-V right into the URL bar now, so perhaps the weird work-around is fixed.
Step 4) Open Desktop Safari & Web Inspector
You’ll need to go to Settings > Advanced and check the Show Debug Menu option. Then you’ll see the option to open the web inspector for the Simulator right from that menu.

With the Web Inspector open, you can debug inside the Simulator just like you could right in a desktop browser with DevTools.

Actual Devices
Simulators are pretty great because they are easy and just a few clicks away. But if for whatever reason you want to test on a real device, you also can do that. As long as:
- The device is connected to your computer (lightning to USB), and it’s “trusted”.
- You have an “inspectable” application open, like Safari.
It should show up in the same Debug menu in Safari and let you inspect the browser right on the real device. It’s a bit surreal to watch the blue-boxes of Web Inspector showing up on your real device!

Looking for some useful browser extensions as well? Click here .
Click here to build your next great project on Media Temple.

Related Posts

For the past 24 years, Media Temple dedicated itself to serving the needs of the digital creative community.

According to statistics from DataProt, about 122.3 billion email spam messages are sent daily.

In the simplest terms, a domain name is your web address, but you can also think of it as the main entrance to your online space.
- domain name trends
- domain names

A Captain Planet Metaphor for the 5 Components of WordPress WorkPress is an open-source, dynamic, content management system (CMS powering over one third of the world’s websites.
- 5 elements of wordpress
- How does WordPress work
- WordPress behind the scenes
- The Best Tech Gifts Under $100
- Traveling? Get These Gadgets!
How to Activate the iPhone Debug Console or Web Inspector
Use Safari's web developer tools to study problematic websites
:max_bytes(150000):strip_icc():format(webp)/ScottOrgera-f7aca23cc84a4ea9a3f9e2ebd93bd690.jpg)
- Saint Mary-of-the-Woods College
- Switching from Android
What to Know
- Activate Web Inspector on iOS: Go to Settings > Safari > Advanced and move the Web Inspector toggle switch to the On position.
- Use Web Inspector on macOS: Connect your iOS device to a Mac and choose the URL to inspect from the Develop menu.
If you run into a bug or another issue with a website on Safari mobile, use the Web Inspector tool to investigate. This article explains how to use the Safari console for iPhone to debug errors with the help of your Mac computer. Instructions apply to iPhones with iOS 14, iOS 12, or iOS 11, and well as Macs with macOS Big Sur (11.0), macOS Catalina (10.15), or macOS Mojave (10.14).
Activate Web Inspector on Your iPhone or Other iOS Device
The Web Inspector is disabled by default since most iPhone users have no use for it. However, if you're a developer or you're curious, you can activate it in a few short steps. Here's how:
Open the iPhone Settings menu.
On an iPhone with an early version of iOS, access the Debug Console through Settings > Safari > Developer > Debug Console . When Safari on the iPhone detects CSS, HTML, and JavaScript errors, details of each display in the debugger.
Scroll down and tap Safari to open the screen that contains everything related to the Safari web browser on your iPhone, iPad, or iPod touch.
Scroll to the bottom of the page and select Advanced .
Move the Web Inspector toggle switch to the On position.
Connect Your iOS Device to Safari on a Mac
To use the Web Inspector, connect your iPhone or another iOS device to a Mac that has the Safari web browser and enable the Develop menu .
With Safari open, select Safari from the menu bar and choose Preferences .
Select the Advanced tab.
Select the Show Develop menu in menu bar check box and close the settings window.
From the Safari menu bar, select Develop and choose the name of your attached iOS device, then select the URL that appears under Safari to open the debug console for that site.
After you connect your device, use your Mac to inspect the website you want to debug and have it open in the Safari mobile browser.
What Is Web Inspector?
Web developers use Web Inspector to modify, debug, and optimize websites on Macs and iOS devices. With Web Inspector open, developers can inspect the resources on a web page. The Web Inspector window contains editable HTML and notes regarding the styles and layers of the web page in a separate panel.
Before iOS 6, the iPhone Safari web browser had a built-in Debug Console that developers used to find web page defects. Recent versions of iOS use Web Inspector instead.
With Safari 9 and OS X Mavericks (10.9), Apple introduced Responsive Design Mode in Web Inspector. Developers use this built-in simulator to preview how web pages scale to different screen sizes, resolutions, and orientations.
To set up Web Inspector on your iPad, open your iPad's Settings and select Safari > Advanced , then turn Web Inspector On . Connect the iPad to a Mac computer, then open Safari on the Mac and select Safari > Preferences > Advanced , then turn on Show Develop menu in menu bar .
You cannot just connect your iPhone to a Windows PC and start using Web Inspector through Chrome like you can with a Mac. Installing package manager software can provide you a sort of workaround, but it's not recommended unless you're familiar with the package management app you intend to use.
Get the Latest Tech News Delivered Every Day
- Add More Features by Turning on Safari's Develop Menu
- 4 Ways to Play Fortnite on iPhone
- How to Activate and Use Responsive Design Mode in Safari
- How to Inspect an Element on a Mac
- What Is Safari?
- How to Clear Search History on iPhone
- How to Use Web Browser Developer Tools
- How to Disable JavaScript in Safari for iPhone
- 10 Hidden Features in macOS Sonoma
- How to Manage History and Browsing Data on iPhone
- How to View HTML Source in Safari
- How to Manage Cookies in the Safari Browser
- How to Change Your Homepage in Safari
- How to Clear Private Data, Caches, and Cookies on Mac
- How to Reset Safari to Default Settings
- How to Manage Your Browsing History in Safari
Inspect WebView in Mac Application
What is the proper way to inspect a WebView in a Mac application?
I can access any iOS simulator or connected device through the Safari Develop menu just not any Mac apps (The entry for the Mac lists "No Inspectable Applications").
All the Mac apps are launched by Xcode and the scheme is set to debug.
Is there something I am missing or are Mac apps not supported? I tried to search the documentation but found nothing.
- Safari Developer Tools
Accepted Reply
Hi, I found this in the About Safari Web Inspector > Get Oriented documentation
( https://developer.apple.com/library/safari/documentation/AppleApplications/Conceptual/Safari_Developer_Guide/GettingStarted/GettingStarted.html#//apple_ref/doc/uid/TP40007874-CH2-SW1 )
WebKit-based Apps
To enable the developer tools in a WebKit-based application other than Safari, enter the following into the Terminal:
I'm having issues with this too. No one making embedded web apps for OSX?
Here's an example project to get you started:
https://dl.dropboxusercontent.com/u/153385/EmbeddedWebkitInspectorTest.zip
Now for a new question. Staring in El Capitan the inspector debugger stalls out when it hits the first breakpoint. In particular it seems that the inspector works, but that the code display never loads, so you can step though the code, but you can't see where you are. To see the problem:
1. defaults write com.hogbaysoftware.EmbeddedWebkitInspectorTest WebKitDeveloperExtras -bool true
2. Then build and run the above app
3. Then click the "Debug JavaScript Test" button
4. Not that the inspectors code display pane never loads.
This is making it difficult to develop my app now that I've moved to El Capitan, any ideas of how to fix the problem?
Somehow related, what if this app is an IOS app that runs as Mac (Designed for iPad)? Looks like in this case, it doesn't even use Safari!
https://stackoverflow.com/questions/75181896/debug-wkwebview-on-ios-app-running-on-mac-designed-for-ipad
There is a way to debug js in vscode when i develop a app embedded Webkit?

IMAGES
VIDEO
COMMENTS
When running safari in an XCode device simulator, the desktop Safari (v6) Develop menu shows those devices. From there, you can fire up the developer tools (DOM browser etc.) for the mobile browser. This helped me debug an mobile safari css issue without hardware.
iOS 16.4 webview can not debug in safari web inspector . You're now watching this thread. If you've opted in to email or web notifications, you'll be notified when there's activity. ... (20E5239a) both on my iphone and Simulator,Safari -> develop shows "no inspectable applications" Safari Safari Developer Tools Post not yet marked as ...
To access the Responsive Design Mode, enable the Safari Develop menu. Follow the steps below to enable the Develop menu: Launch Safari browser. Click on Safari -> Settings -> Advanced. Select the checkbox -> Show Develop menu in menu bar. Once the Develop menu is enabled, it'll show up in the menu bar as shown in the image below: Note ...
There are a few caveats to be aware of when using the Web Inspector with an iOS device or simulator: If you want to use this on an actual device you'll first need to enable the Web Inspector on iOS. To do this, go to the Settings app and then Safari > Advanced and toggle the Web Inspector on. Whilst the Web Inspector can interrogate WKWebView ...
To debug background scripts, open the Develop menu, find the menu item for the iOS or iPadOS device you wish to inspect, and then find the item with the name of the extension, "Extension Background Page", and the file name of the background script. Toolbar pop-up. To debug your extension's pop-up, open your pop-up on the device.
While working on the WebView IOS app it is very important to know how to debug the WebPage or WebApp (ReactJs App) which we rendered WebView of the IOS app. Step 1: Device Side Settings (iPhone ...
A step-by-step guide on setting up Xcode to debug websites in iOS Safari using Web Inspector on your Mac.And as all browsers on iOS use Safari's rendering en...
Enabling the Develop Menu Item In Safari you will need to enable the Develop menu item before you can see any other available devices for inspection. Open Preferences ⌘ + , and open the Advanced section. At the bottom, check the box next to "Show Develop menu in menu bar". Now you should see the Develop menu item and can chose web views ...
On your Mac, open up Safari. In the Mac toolbar under Develop, select the Simulator option beneath your device's name. Pick the iOS Safari tab loaded in the Simulator. Web Inspector will launch to start debugging mobile Safari! From Safari on Mac: Device > Select Simulator > Select the webpage open in the Simulator.
Now that your iOS simulator or device is running, open Safari and access the Develop menu. ... Debugging WebView content in a mobile app is an essential skill for any developer working on ...
How to debug WebViews on iOS devices with Inspect. Inspect can only debug web content in developer provisioned applications or applications with the com.apple.webinspector.allow entitlement. Which WebView types are supported on iOS? WKWebView; WebView; JSContext; This is a limitation from Apple, and something Inspect can't change.
To enable Web Inspector in Safari(or Safari Technology Preview): click the Safari(or Safari Technology Preview) menu bar item. select Preferences…. (or press ⌘,) go to the Advancedpane. check the Show Develop menu in menu barcheckbox. Show Web Inspector(or pressing ⌥⌘I) in the Developmenuor by right-clicking on any page in Safari(or ...
Open your device. Open the device or the Simulator on which you want to debug the performance issues. Go back to Safari and click on Develop in the top menu. There, you'll see all the available devices. Choose the one you're working with and select the WebView you wish to debug.
16. Safari technology preview. You'll need this to get Safari to pickup your iOS 11 device. Any idea if it's possible to use the new "connect via network" option in iOS 11/Xcode 9 to remote debug a web app? I can't see my device in Safari's Develop menu so I'm guessing not, unfortunately.
Open Safari Browser. Under the Safari option, click on 'Preferences'. Under the 'Advanced' tab, enable check "Show Develop menu in menu bar". Steps for debugging: Run the React Native app with WebView in iOS device/ iOS simulator in debug mode. Open Safari, from the menu bar, we need to click on 'Develop' option, 'Develop' > {Device Name ...
The iOS Simulator is an app that comes bundled with Xcode. Xcode is free and you get it from the app store. Step 2) Open Simulator. ... It should show up in the same Debug menu in Safari and let you inspect the browser right on the real device. It's a bit surreal to watch the blue-boxes of Web Inspector showing up on your real device!
Activate Web Inspector on iOS: Go to Settings > Safari > Advanced and move the Web Inspector toggle switch to the On position. Use Web Inspector on macOS: Connect your iOS device to a Mac and choose the URL to inspect from the Develop menu. If you run into a bug or another issue with a website on Safari mobile, use the Web Inspector tool to ...
To see the problem: 1. defaults write com.hogbaysoftware.EmbeddedWebkitInspectorTest WebKitDeveloperExtras -bool true. 2. Then build and run the above app. 3. Then click the "Debug JavaScript Test" button. 4. Not that the inspectors code display pane never loads.
Android can use desktop Chrome's web inspector to debug HTML/CSS issues embedded in an App's WebView, as long as you connect them through USB. ... Because there are some issues that only affects webview, so viewing it from iOS Safari cannot reproduce some issues. ios; webview; safari; Share. Improve this question. Follow asked Apr 19, 2018 at 2:51.
I am using iPhone simulator to run a UIWebview, and Safari browser (on my mac) in order to debug the js / html / css code (via "develop" menu -> iPhone Simulator -> choosing my webview). Yestarday, the iPhone-simulator option disappeared from my "develop" menu: (as you can see, the "iphone-simulator" is missing here (it is opened in the ...
This key is automatically added to iOS applications for Xcode debugging, but it must be added manually to Mac applications. If you only want to use Safari to inspect while Xcode is running a debug build, add the entitlement file to a Debug configuration and not the Release configuration.